Download

1 / 143
1.43k likes | 1.71k Vues
CRYSTAL REPORTS XI R2. Allows you to produce the report you want from virtually any data source. Designed to help analyze and interpret important information. Used to produce simple, complex or specialized reports. Introduction to Crystal Reports. Create any report you can imagine

E N D
Allows you to produce the report you want from virtually any data source. Designed to help analyze and interpret important information. Used to produce simple, complex or specialized reports Introduction to Crystal Reports
Create any report you can imagine Can be used for windows as well as web based applications Runtime Customization (Reports generated dynamically based on parameters/formulas) Competency of Crystal Reports
Improved usability Expanded Application Development Capabilities Integration with Business Objects Enterprise XI R2 Benefits of Crystal Reports XI R2
There are five phases of report design. Define the concept Sourcing the data Creating the design Developing and testing the design Deploying and operating the report Phases of Report Design
Beginning with the end in mind Have some idea to the final report to look like(i.e a Prototype) Prototype can be a simple Crystal Report or Excel sheet or Word Document Defining the concept
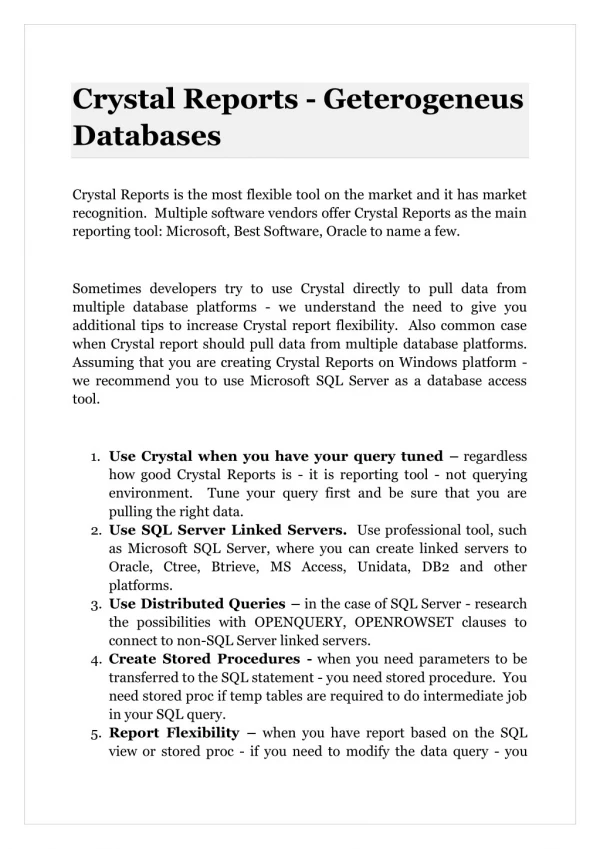
Determine where the data for your report resides (a database, file etc) Determine relations between data A common problem here is that the data you want to include does not exist or relation do not exist Sourcing the data
The best report is one that is completed on paper and is then recreated using Crystal Reports Revisit your prototype and decide which of the fields in the report are Directly from database Calculated from database fields Formula fields Creating the Design
Input your data and test the report on different platforms Any performance issues, revisit your report design Check relations/constraints (for any cartesian) Check query for performance improvement Put option of Grouping on Server Eliminate Unused Formulas Developing and Testing the Design
The last step in this process is to consider how your report is going to be used Will it be exported ? If yes, where ? Excel (.xls) Word (.doc) Acrobat (.pdf) Rich Text Format (.RTF) XML Text Separated Values (.CSV) Will the generated report be mailed/stored in centralized location/web-based ? Deploying and operating the report
Connect to a data source Connect to database Adding tables & Linking Tables Defining the design environment Inserting objects on a report Positioning and sizing objects Formatting objects Previewing and saving the report Creating a Report
Opening Crystal Reports • In windows click start, go to programs then select Crystal Reports • Click ‘Standard Report Wizard’ or ‘Blank Report’
Selecting Data Standard Report creation wizard opens. Click
Standard Report creation wizard has five sections. Current connections List of currently connected data sources Favorites List of commonly used data sources, maintained in favorites History List of the five recently used data sources Selecting Data (Continued)
Create New connection Shows sub folders for various data sources you can connect to. Repository Contents of your repository through the Crystal Enterprise explorer Selecting Data (Continued)
Selecting Data (Continued) Select Tables Click
Selecting Data (Continued) Selected Table
Design Area Click Field Explorer
Design Area (Continued) • Click Field Explorer on the Standard toolbar. The Field Explorer dialog box appears
Field Explorer Table Name Column Names
Design Tab is the place where you do most of the initial work when creating the report It designates and labels the various part of the report It has the structure and instruction for creating the final report Design Tab
Crystal Reports automatically creates five sections in the design tab when you begin creating the report Report Header Used for Report title and other information which you want to appear at the beginning of the report Page Header Information what you want to appear at the top of each page Details Body of the Report Report Footer Information appear only once at the end of the report Page Footer Page number and other information you want to appear on the bottom of each page. Design Tab Areas
Two additional sections Group Header Holds the Group name field Printed once at the beginning of the group Group Footer Holds the summary value Printed once at the end of the group Design Tab Areas (Continued)
Expand the Database field node Expand a table Click the field which you want to display in the report Drag into Details section of the report Inserting Field
Inserting Field (Continued) Object Frame appears when you drag a field into the Report
Inserting Field (Continued) View of Design Area Inserted field
Click the field which you want to resize Move the cursor over the resizing handle until the cursor turns into a resizing cursor Resize the field Resizing Field
Resizing Field Resizing Handle Resizing Cursor
Review the work Click print preview on the toolbar to activate preview tab Click
Review the work(Continued) Preview of the Design should look similar to this
Adding Summary Info Used to find information related to the report quickly Enter the Information
Click the design tab Go to field explorer Expand Special fields Choose Report Title Drag the cursor over the report Place the Title in the Report Header Adding a title
Select the object which you want to format Right click and select format field from the drop down menu Format Editor will open You can change the format for the object - You can add borders, colors and shading to a field - You can add hyperlinks to the objects Formatting Object
Formatting Object (Continued) Selected Object
Formatting Object (Continued) Formatted Object
Formatting Object (Continued) Use the Format Painter to copy absolute or conditional formatting properties from one report object to one or more target objects. Select a source object or field in your report and click Format Painter. Click the target object or field you want to apply the formatting to.
Record Selection • Used to restrict the records in the report • It is like a filter applied in report • Click Select Expert on the Expert Tools toolbar • Select the field to which you wish to restrict the data (Eg.Cutomer.Country)
Record Selection (Continued) Select the condition
Record Selection (Continued) Select the name of the country This selection will return only those records for which the country is equal to England
Deleting a Field Select the Field Press Delete Key
Sorting Records • Click Sort Record Expert • Select the field on which you want to apply sort • Select sort direction Select the field Click Select the sort order
Sorting Records (Continued) Sorted Output
Grouping the Report • It provides flexibility for customizing the report • While on the Design tab,Click insert group Select the field for grouping
Adding image file to the report Click insert picture Browse and Select Image file
Adding image file to the report (Continued) Final Report looks like this: Image