Download
1 / 22
220 likes | 410 Vues
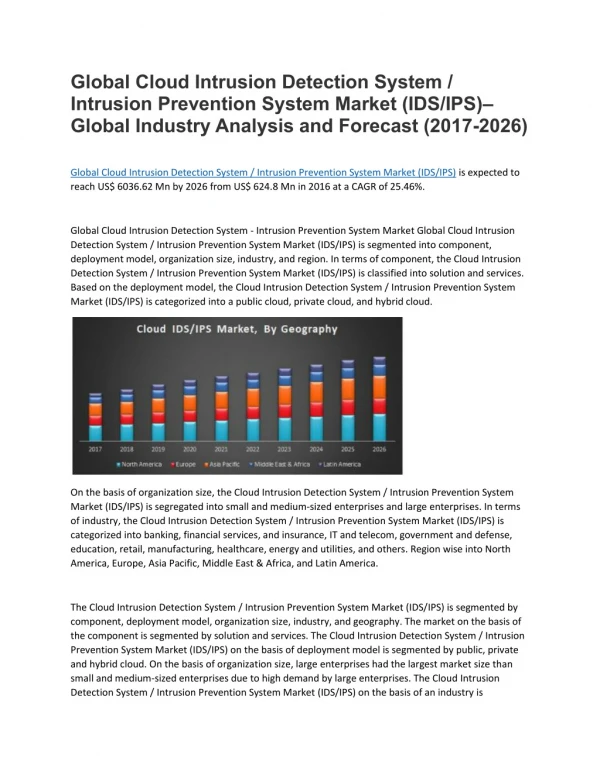
Numerical Modeling of a Salinity Intrusion Barrier Saltwater Intrusion Prevention System. Developed Through a Cooperative Research & Development Agreement Patented Technology owned by Saltwater Separation, LLC. Saltwater Separation, LLC Team E. Robert Kendziorski

E N D
Numerical Modeling of a Salinity Intrusion BarrierSaltwater Intrusion Prevention System Developed Through a Cooperative Research & Development Agreement Patented Technology owned by Saltwater Separation, LLC • Saltwater Separation, LLC Team • E. Robert Kendziorski • robertk@saltwaterseparation.com • 949.677.1991 • Charles H. Tate, P.E. • ctate@saltwaterseparation.com • 601.218.2173 ERDC-CHL Team Jose E. Sanchez, P.E. Robert Bernard, PhD Robert.S.Bernard@usace.army.mil Phu Luong, PhD Phu.V.Luong@usace.army.mil
Salinity Intrusion Barrier System OUTLINE • Challenges • Cooperative Research and Development Agreement (CRADA) • US Army Engineer Research and Development Center – Coastal and Hydraulics Laboratory (ERDC-CHL) • PAR3D • Miraflores Locks • Simulation basis • Experiments • Results • Recommendations and Conclusions
Salinity Intrusion Barrier System CHALLENGES • Miraflores Lake brackish condition • Current estimates of 1ppt concentration (ERDC-CHL 2000 study) • No salinity intrusion barrier or system in place • Quality issues for some uses • Increased traffic demand • Current operations general range between 30 and 40 ships per day • Future expectations of up to 53 ships per day • Unsteady flow in the downstream lock approach conditions during emptying cycle • Inconsistent navigation condition (1 out of 30 may impact the lock structure, as per WPSI) • Possible Canal expansion
Salinity Intrusion Barrier System CRADA • What is it? • Cooperative Research and Development Agreement • Benefits • Allows USACE to partner with other organizations • Shares information, knowledge, discoveries • Parties involved • US Army Engineer Research and Development Center, Coastal and Hydraulics Laboratory • Water Processing Systems Incorporated
Salinity Intrusion Barrier System ERDC-CHL • Expertise • 75 years experience in physical and numerical hydraulic modeling • 250 personnel • 140 Engineers and Scientists • 56 with PhDs • 60 with MS degrees • Resources • Many numerical models available • PAR3D chosen • High Performance Computing Center on site • Among the top 10 in the world
Salinity Intrusion Barrier System PAR3D • What is it? • 3-dimensional incompressible flow numerical model • Accommodates • Deforming grids • Free-surface displacement • Multiple processors • Capabilities include • Heat and dissolved-gas transfer and transport • Salinity transport • Temperature stratification and mixing • Sediment and biomass transport (with oxygen demand) • Turbulence modeling including buoyancy • Flow driven by bubble plumes and mechanical mixers
Salinity Intrusion Barrier System PAR3D (CONTINUED) • Governing equations • Navier-Stokes equations for incompressible flow • K-Epsilon turbulence model • Pneumatic injection specialty • Published in “Applied Mathematical Modeling” • Independent peer review for application to independent experimental data, 2000 • Previous applications • Taylorsville Lake intake structure, internal flow in the structure • WES Riprap Test Facility, open-channel flow around a bend • McCook Reservoir (in design), pneumatic bubble plume application
Salinity Intrusion Barrier System MIRAFLORES LOCKS INLAND SIDE OCEAN SIDE
Salinity Intrusion Barrier System MIRAFLORES LOCKS model grid area
Salinity Intrusion Barrier System INITIAL SIMULATION BASIS • Average depth (50-ft) • No tidal action • No vessel • Approximate bathymetry (el. –50ft) • Lock exit structure modeled • Channel width approximated (110 to 220-ft) • Starting salinity • 10 ppt DS of miter gates (1000-ft stretch)
Salinity Intrusion Barrier System MODEL Pacific Ocean Guide wall Miter gates • Total length = 1000-ft • 110-ft wide • 50-ft deep Wing wall 100-ft
Salinity Intrusion Barrier System Model Simulations • Existing conditions without salinity barriers • During emptying cycle • Simplified lock release (steady state outflow) • 15 min cycle with 3kcfs flow rate • 20 min after emptying cycle ends (re-stratification) • Effects of bubble curtains • With/without pneumatic injection • Bubble curtain setup • 1 bubbler 400-ft from miter gates (WPSI feasibility report) • 2 bubble curtains (100 & 200-ft from each other) • 4 bubble curtains (100-ft from each other) • 8 bubble curtains (50-ft from each other) • Fresh water injection rates with 4 bubble curtains
3kcfs injection, after 15 min emptying cycle Water injection (50-ft from miter gates) no injection, 20 min after cycle Salinity Intrusion Barrier System EXISTING CONDITIONS:
563 cfs fresh water injection – 3hr simulation water injection bubbler bubbler bubbler bubbler water injection bubbler bubbler bubbler bubbler 563 cfs fresh water injection, 1100 scfm/curtain – 3hr simulation Water injection (50-ft from miter gates) Salinity Intrusion Barrier System BUBBLE CURTAINS vs. NO CURTAINS:
bubbler bubbler bubbler bubbler Salinity Intrusion Barrier System FOUR BUBBLE CURTAINS:1100 scfm/curtain, 563cfs fresh water, 3hr animation (10min intervals) water injection
bubbler bubbler bubbler bubbler Salinity Intrusion Barrier System FOUR BUBBLE CURTAINS:1100 scfm/curtain, 563cfs fresh water, 9hr simulation water injection
Salinity Intrusion Barrier System Water injection rates (4 bubble curtain design) * Time reflects salinity concentration at 100-ft from miter gates only. Lower concentrations were indicated further downstream sooner.
Salinity Intrusion Barrier System ADDITIONAL SIMULATION BASIS • Tidal fluctuations • Max depth – 64ft • Min depth – 44ft • Vessel exiting lock chamber • With propeller action • Without propeller action • Stratified salinity distribution
Salinity Intrusion Barrier System Tidal fluctuation comparison
Salinity Intrusion Barrier System Ship and propeller mixing characteristics • Ship Model • Dense grid • 2000-ft channel • Starting at US miter gates • Divided into 100-ft cells • Depth: 50 ft • Panamax type ship • 965’l x 106’w x 39.5’d (centered in channel – exiting lock chamber) • 26-ft diameter propeller helix • 20,000 hp • Simulation • Initial conditions • 5 ppt starting 200-ft downstream of ship • 1 ppt inside of lock chamber • 563 cfs fresh water injection 100-ft from DS miter gates • 4 bubble curtain design
Salinity Intrusion Barrier System Ship and propeller mixing characteristics Ship only Pacific Ocean Stern Bow Ship < 1 ppt Ship with motor in operation < 1 ppt 563 cfs fresh water injection, 1100 scfm/curtain – 1hr simulation Initial condition: 5 ppt starting 200-ft downstream of ship
Salinity Intrusion Barrier System Recommendations and Conclusions • Conclusions • Best design tested – 4 bubble plumes at 1100 standard cfm/location with minimum 563 cfs fresh water inflow • More air flow does not improve performance • More air injection points does not improve performance • Higher water flow rates do improve performance, up to a certain limit • Tidal fluctuations have minimal impacts on performance • Ship and propeller have minimal impacts on performance • Recommendations • 2D physical tests for salinity transfer at bubble plumes • Experiments to study downstream conditions during emptying cycle (turbulent currents – baseline conditions)