Download
1 / 14
350 likes | 749 Vues
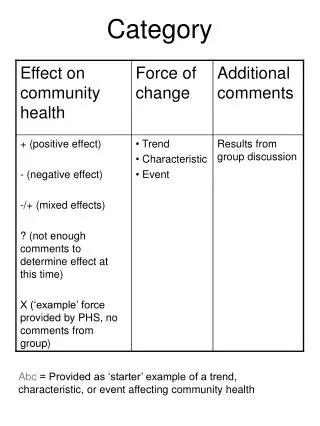
Category Plan. Category Management Team: Date:. 1. Category Strategy. Leverage the information on “5. Supply Market Analysis” and “6. Supplier Management” slides. Leverage the information on “3. Vision and Objectives” slide. Task 9.1. 2. Category Overview. Demand Analysis.

E N D
Category Plan Category Management Team: Date:
1. Category Strategy Leverage the information on “5. Supply Market Analysis” and “6. Supplier Management” slides Leverage the information on “3. Vision and Objectives” slide Task 9.1
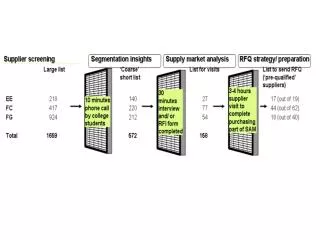
2. Category Overview Demand Analysis Supplier Analysis Key Business Drivers Asia Africa by geography Today Future NA LA Eur Global Pac Pak Safety 1 1 $ 100 Supplier A $ 100 Eur, Quality 1 1 $ 41 Supplier B $ 11 $ 10 $ 20 $217 Productivity 1 $ 40 Supplier C $ 40 NA, Reliability 1 $ 20 Supplier D $ 20 $278 Cost Management 1 $ 20 Supplier E $ 20 Demand Management 1 1 $ 64 Next 5 $ 20 Africa $ 292 All Others $ 123 $ 7 $ 42 $ 8 $ 112 Asia Pac, LA, $18 Pak, $9 Total $ 278 $ 18 $ 54 $ 9 $ 217 $ 576 $54 Supplier Market Analysis Focus Areas Today Future by subcategory Market Size 150000 MM USD Compliance 1 1 Subcat Subcat Key Players Reach $MM sales $MM spend Demand Management 1 1 Subcat 5, $11 4, $57 $ 11,540 URS Eng global Negotiations 1 1 6, $- $ 20,488 VINCI Construction global Aggregation/Consolidation 1 Subcat $ 11,540 Kobe Steel global IRIS 1 3, $87 Supply Chain Optimization 1 Re-specification 1 Local Content 1 Subcat Subcat 2, $53 1, $368 Market Dynamics Key Opportunities Asia Africa Target Benefit NA LA Eur Global Movement is away from EPC contracts Pac Pak 2.3 Q3/05 Large Project Construction $ 368 Oil & Gas Capital Budgets are increasing over the next few Subcat 1 $ 183 $ 1 $ 12 $ 2 $ 170 0.6 Q4/05 Inspection Services $ 53 years, increasing Engineering & Construction Demand Subcat 2 $ 38 $ 2 $ 10 $ 2 $ 1 0.6 Q4/06 Small Pressure Vessel Fab $ 87 Construction is projected to increase 21% in 2005 and 28 Subcat 3 $ 27 $ 8 $ 30 $ 2 $ 20 2 Q1/06 $ 57 Small Project Construction percent in 2006. Subcat 4 $ 24 $ 5 $ 3 $ 25 4.5 Q1/06 Supplier Management $ 11 Engineering market will tighten before construction labor Subcat 5 $ 6 $ 2 $ 2 $ 1 1 Q1/05 Heat exchanger fabrication $ - market Subcat 6 0.5 Q1/07 Large Pressure Vessel Fab Total $ 278 $ 18 $ 54 $ 9 $ 217 $ 576 Task 2.2 Task 2.2 Task 1.1 Tasks 2.2 & 2.5 Tasks 2.6 & 6.1 Tasks 8.1
3. Vision and Objectives Task 1.1 Should have been developed during the Category Setup process Engineering Services & Small Capital Project Construction ($172.4MM) Preferred Agreements Currently in Place Engineering Services ($86.2MM) Inspection Services ($11.2MM) Capital Equipment ($37MM) Construction Services ($38MM) • NDE Techs • Supplemental API / NBIC Inspectors • Diving Inspectors • Marine Inspection • Small Project Construction • Piping Prefabrication • Pressure Vessels • Heat Exchangers • Staffing • Small Project • Large Project
4. Demand Analysis 50% 50% 50% 50% 50% 50% 50% 50% 50% 50% Task 2.2 Task 2.3 Task 2.2 Task 3.2
5. Supply Market Analysis Buyer’s Market Mutual Dependence High Buyer Power Independence Seller’s Market Low Low High Seller Power Tasks 2.5 & 2.6 Tasks 2.5 & 2.6 Task 2.5 Cat2 cat4 Cat3 Tasks 5.1 & 6.1 Task 4.1
6. Supplier Management Barriers to Entry L M H Power of Suppliers Internal Rivalry Power of Buyers L M H L M H L M H Threat of Substitutes L M H Task 2.6 Task 2.2
8. Opportunity and Initiative Plan 2005 2006 2007 Q1 Q2 Q3 Q4 Q1 Q2 Q3 Q4 Q1 Q2 Q3 Q4 Task 9.1 Implementation Plan Large Proj Eng. Inspection Services Heat Exchangers - NA Small Proj Const. Contractor Mgmt Organization Capability Heat Exchangers – UK, APA Small Press Vessel Large Pressure Vessels Offsite Piping Prefab Diving Services Preferred Supplier Management Stretch Target $ 10.1MM 100% Target: $ 7.3MM 100% Stretch Target: $ 17.2MM 100% Target: $ 11.1MM 100% Stretch Target: $ 5MM 100% Target: $ 2.5MM 100%
9b. Investment Recovery and Inventory Solutions (IRIS) Category Planning Task 7.1 Task 7.1 Task 7.1 Task 7.1
9c. Supplier Diversity/Local Content Category Planning Task 7.2 Task 7.2 Task 7.2 Task 7.2
9c. Supplier Diversity/Local Content Guide Task 7.2 Task 7.2 Due Diligence Questions Spend North America International Current Annual Total $ MM Domestic $ MM Int’l $ MM • What are your high-level Corporate Supplier Diversity goals & strategies? • What countries will be utilizing your Category Plan? • What is the Supplier Diversity Training Plan for: • Category Managers & Team • Suppliers • What is your estimated spend by country? Forms Task 7.2 • What are your goals & Strategies to utilize Local Content? Available in Ariba • What are the data resources utilized for this category? • What are your outreach efforts? • What are the data resources utilized for this category? • What are your outreach efforts? Task 7.2 Targeted Annual North America Spend by 1st Tier Diverse Supplier Type Task 7.2 Targeted Annual International Local Content Spend
9d. Extended Enterprise Category Planning Task 7.3 Task 7.3 Task 7.3 Task 7.3