Download
1 / 7
70 likes | 163 Vues
Mash-it-up G o o g l e Style. Put your data on the Map. G o o g l e Maps. One of the easiest APIs to use. In 5 minutes you can have a simple map on your site. First step – Get a Google Maps API Key: http://www.google.com/apis/maps/. The 5 Minute GMap.

E N D
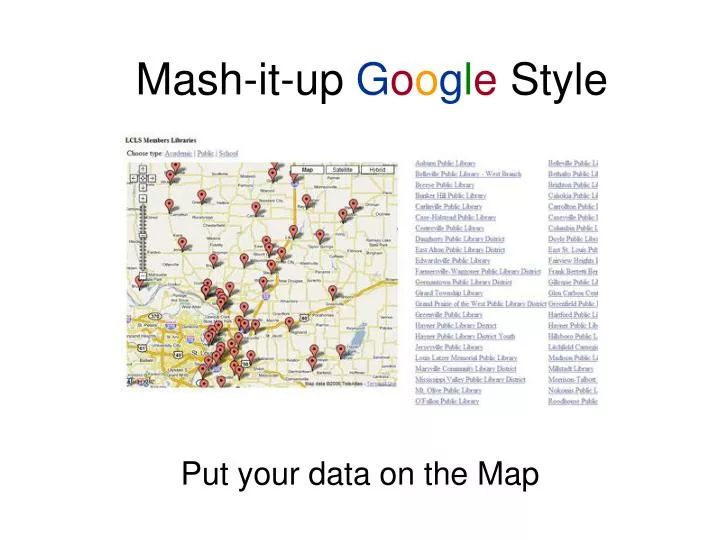
Mash-it-up Google Style Put your data on the Map
Google Maps • One of the easiest APIs to use. In 5 minutes you can have a simple map on your site. • First step – Get a Google Maps API Key: http://www.google.com/apis/maps/
The 5 Minute GMap • Get the “Hello World” example: http://www.google.com/apis/maps/documentation/#The_Hello_World_of_Google_Maps • Copy that text into a new HTML file. Add your key (Replace ‘key=abcdefg’, with ‘key=the big long key from Google’) • Lets add some controls (zoom/pan): map.addControl(new GSmallMapControl()); map.addControl(new GMapTypeControl());
Add markers to the map • We need a Lat/Long coordinate in the format: XX.XXXXXX, -YY.YYYYYY(ex. 36.601145,-121.894684 – Portola Plaza) • Create a new point:var point = new GLatLng(36.601145,-121.894684); • Add it to the map!map.addOverlay(new GMarker(point)); • Save your work and view it in your browser of choice!
All your data are belong on Google Maps • For plotting many points, Google has included a way to import specially formatted XML files. With a simple loop all your points will be plotted to the map!http://www.google.com/apis/maps/documentation/#Using_XML_and_Asynchronous_RPC • Sample format: <markers> <marker lat="37.427770" lng="-122.144841"/> <marker lat="37.413320" lng="-122.125604"/> <marker lat="37.433480" lng="-122.139062"/> <marker lat="37.445427" lng="-122.162307"/> </markers>
Plotting Dynamic Data • LCLS delivery routes are stored in a MySQL database. • Using ASP.NET and a custom API, the routes are outputted into an XML formatted document which is loaded into the Google Map API:http://www.lcls.org/api/query/?method=lcls.members.getDeliveryRoute&routeid=1&day=friday
Questions? Seldom updated blog: http://cdeweese.blogspot.comEmail: chris.deweese@gmail.com