Download
1 / 22
220 likes | 225 Vues
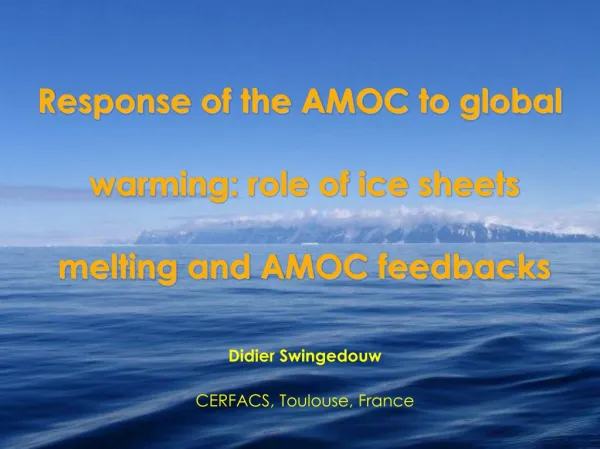
This study explores the effect of Antarctic Ice Sheet melting on long-term global warming. The research examines the impact on surface temperature, ocean circulation, and projections of sea-level rise. Results show that melting from the Antarctic ice sheet has a significant cooling effect on the climate system, reducing global warming. This negative feedback is attributed to changes in elevation, albedo, and freshwater input into the oceans. The study highlights the importance of considering ice sheet dynamics in climate models.

E N D
Antarctic ice-sheet melting provides negative feedbacks on future global warming Didier Swingedouw (1), Fichefet T. (1), Huybrechts P. (2), Goosse H. (1), Driesschaert E, Loutre M.-F (1), (1) Université catholique de Louvain, Institut d’Astronomie et de Géophysique Georges Lemaître, Belgium (2) Vrije Universiteit Brussel, Department of geography, Belgium
Major ice sheets on the Earth • Greenland • Grounded ice is equivalent to 7 m of sea-level rise • Area of 2 millions km² (81% ice covered) • Antarctica • Grounded ice is equivalent to 61 m of sea-level rise • Area of 14 millions km² (98% ice covered) • Huge ice shelves
NADW AABW Schneider et al., 2007 Thermohaline circulation and climate • Thermohaline circulation (THC): Oceanic circulation related to temperature and salinity gradient • Past abrupt climate changes related to changes in the THC (Younger Dryas, McManus et al. 2004) due to massive ice-sheet melting in the North Atlantic • Southern Ocean have also experienced massive ice-sheet melting (Kanfoush et al. 2000), which could explain some warm periods in the North Atlantic (Bølling-Allerød, Weaver et al. 2003) • Future of the THC: no Antarctic ice-sheet melting in most models
Outlines What could be the effect of Antarctic Ice-Sheet (AIS) melting on long term global warming ? • Can the AIS melt in the future ? • What will be its effect on surface temperature ? • What will be its effect on ocean circulation ? • What are the implications for the projections of sea-level rise ?
ECBILT QG, T21, 3 levels CLIO GCM, 3°x3°, 20 levels ISM 10km 31 levels VECODE Tools: L0VECLIM earth system model
CO2 (ppm) 1120 4xCO2 CTRL 280 Sans 0 140 3000 Year AGIS GIS AIS Experimental design We analyse several scenario simulations at 4XCO2 • Without any ice-sheet melting (fixed) • With ice-sheet melting from both Greenland and Antarctic ice sheets (AGIS) • With melting from Greenland ice sheet only (GIS) • With melting fromAntarctic ice sheet only (AIS)
Cryospheric response in scenarios CTRL AIS AGIS GIS fixed • After 500 years the AIS begins to loose mass in scenarios (0.14 Sv into the Southern Ocean in AIS after 3000 years) • Lag due to the large thermal inertia of the Southern Ocean (same lag for sea-ice cover reduction in the south) • Greenland looses mass after a century and has totally melted in 3000 years in GIS AIS fixed GIS AGIS AIS AGIS GIS fixed
AGIS-fixed: years 2900-3000 Surface Air Temperature (SAT) a) SAT AIS melting reduces the Climate Sensitivity by 10% b) Sea-ice thickness SAT: AGIS-fixed The north is warming, the south is cooling Because of sea-ice differences Temperature response in scenarios
AABW cell response in scenarios • The AABW cell weakens the first 300 years • Then it recovers • It stabilizes around CTRL value with AIS melting • And 25% over CTRL value without AIS melting • Why such an increase under global warming in AABW production? AABW export at 30°S AIS AGIS CTRL GIS fixed
4XCO2 fixed - CTRL after 3000 years Explanation for the AABW enhancement in scenarios without AIS melting • SST increases in the Southern Ocean • As the SSS, which increases surface density at some places, which increases AABW production • This increase in SSS is mainly due to changes in sea-ice freshwater forcing
AABW NADW NADW AABW NADW cell response in scenarios NADW export at 30°S AIS • NADW cell weakens more with GIS melting (Driesschaert et al. 2007), while AIS melting reduces this weakening • An illustration of the « bipolar ocean seesaw » process from Stocker et al. (1992) CTRL fixed AGIS GIS
CTRL fixed AGIS Climate-ice sheet interactions Mean SAT Why such different climatic responses?
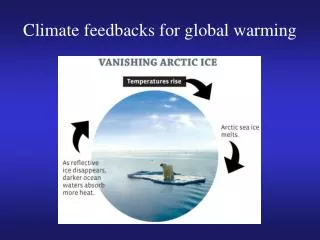
Climate-ice sheet feedback Ice-sheet melting • Elevation and Albedo (+) • freshwater input into the oceans (-) • … • Temperature • Precipitation Sign? Climate
Ice-sheet melting = Melting of the ice sheets + Thermal expansion of the oceans Climate Climate-ice sheet feedback: a sea-level rise viewpoint Sea-level rise
Greenland ice sheet • « on line »: GIS melts as much as 7.9 m sea-level rise equivalent in 3000 years • « off line »: GIS melts as much as 3.4 m sea-level rise equivalent in 3000 years • Strong positive feedback: elevation and albedo feedbacks dominate over negative feedbacks • Thermal expansion contribution: 1.5 m «on line», 1.2 m «off line» = slight negative feedback • Total positive feedback of 4.6 m sea-level rise equivalent
Température de l’océan : on line – off line • Thermal expansion contribution : 2.3 m « on line »; 1.2 m « off line » = important negative feedback • Total negative feedback of 5.5 m Antarctic ice sheet • « on line »: AIS melts as much as 3.2 m sea-level rise equivalent • « off line »: AIS melts as much as 10.0 m sea-level rise equivalent • Strong negative feedback: freshwater input feedback dominates over the others
Conclusions • AIS melting reduces global warming especially in the Southern Hemisphere • AIS melting reduces the Atlantic THC weakening • AIS melting is governed by a strong negative feedbacks implying climate interactions • For all these reasons AIS has to be coupled interactively in coupled models for long-term climate projections
Outlooks • Test the robustness of the former processes within an ensemble of parameter set in LOVECLIM • Evaluate the AIS melting effect in other models (by isolating its effect through an experimental design similar to ours) • Understand the mechanisms for the “bipolar oceanic seesaw” (under debate since a paper from Seidov et al. 2005)
Thank you ! Mailto: swingedouw@astr.ucl.ac.be Web: http://dods.ipsl.jussieu.fr/dssce/public_html/index.html
Greenland ice sheet • « on line » : GIS melts as much as 7.9 m sea-level rise equivalent in 3000 years • « off line » : GIS melts as much as 3.4 m sea-level rise equivalent in 3000 years • Strong positive feedback : elevation and albedo feedbacks dominates over freshwater input feedback • Thermal expansion contribution : 1.5 m «on line», 1.2 m «off line» = slight negative feedback • Total positive feedback of 4.6 m sea-level rise equivalent
Température de l’océan : on line – off line • Thermal expansion contribution : 2.3 m « on line » ; 1.2 m « off line » = important negative feedback • Total negative feedback of 5.5 m Antarctic ice sheet • « on line » : AIS melts as much as 3.2 m sea-level rise equivalent • « off line » : AIS melts as much as 10.0 m sea-level rise equivalent • Strong negative feedback: freshwater input feedback dominates over the others