Download

1 / 40
430 likes | 626 Vues
PET/CT Imaging and Cancer Response to Treatment Dr. François Bénard. Potential Conflict of Interest. None. PET/CT imaging and cancer response to treatment. François Bénard, MD, FRCPC BC Cancer Agency. Cancer Resistance. Increased efflux of drug (P-glycoprotein and others)

E N D
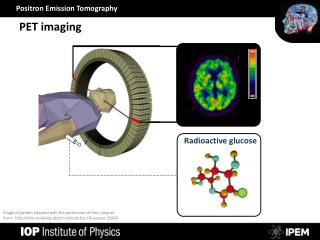
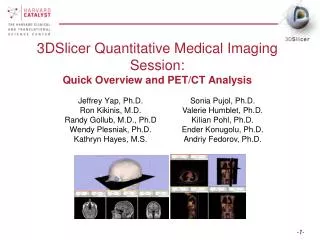
PET/CT Imaging and Cancer Response to TreatmentDr. François Bénard
PET/CT imaging and cancer response to treatment François Bénard, MD, FRCPC BC Cancer Agency
Cancer Resistance • Increased efflux of drug (P-glycoprotein and others) • Decreased influx/transport • Altered or absent binding sites • Enzymatic inactivation • Alternate growth pathways
Why use surrogate measures of tumour response? • Ultimate goal (enhanced patient survival, quality of life, reduced costs) are appropriate endpoints for phase 3 trials • Phase 2 trials need intermediate endpoints to speed up drug discovery and reduce trial costs • Rapidly identify ineffective treatments • Speed up the identification of resistance and target patients with sensitive or resistance phenotypes to identify causes (host-related, tumour related)
Treatment response biomarkers • Plasma or urine proteins (PSA, CA 15.3, CA 125, CEA) • Circulating tumour cells • Metabolomics profiles (urine, plasma) • Histopathology/immunofluorescence (biopsies) • Imaging methods • Conventional (morphological: CT, MRI, US) • Functional • DCE/Diffusion MRI • Perfusion CT • Nuclear Medicine / PET • Optical (surface imaging)
Conventional Tumor Response Assessment • Usually performed using cross sectional imaging • WHO criteria replaced with RECIST criteria • Modified RECIST criteria published 2009 • Morphological measurements of solid tumours • Assessment at least 8 weeks from treatment initiation
RECIST 1.1 • Requires a measurable lesion • Size 10 mm (CT, caliper) to 20 mm (Chest X-ray) • Enlarged lymph node > 15 mm in short axis • Non-measurable: < 10 mm (or nodes 10-15 mm short axis), leptomeningeal, ascites, pleural or pericardial effusion, inflammatory breast disease, lymphangitic involvement skin/lung, most bone metastases, previously irradiated fields, cystic lesions
RECIST 1.1 • Up to 5 measurable lesions • Maximum of 2 lesions per organ • Selected by size (longest diameter) • Lymph node size measured on shortest diameter • Sum of the diameters of lesions (longest for non-nodal, shortest for nodes)
Treatment response prediction vs measurement • Prediction • A test to predict response to treatment before it is administered • Typically predicts sensitivity of a tumour to respond to treatment • Classical examples: ER and HER2/neu in breast cancer • Response measurement • Measurement of tumor sensitivity after onset of treatment • Biomarkers or imaging • Documents treatment resistance
Limitations of planar measurements • Delay in identifying resistance • Not adapted to evaluate cytostatic rather than cytotoxic treatments (progressive disease remains progressive disease even if tumor growth is slowed) • May not identify the appearance of treatment resistant clones • Not suitable for bone metastases or when no measurable lesion is available • Residual fibrotic/necrotic masses
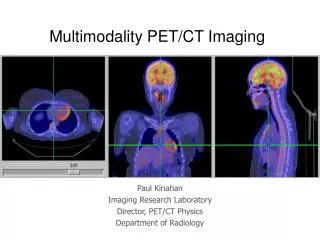
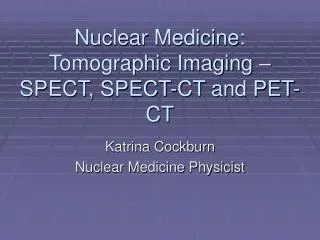
Functional Imaging in Cancer Response Assessment • Conventional Nuclear Medicine • Bone scintigraphy and some receptor binding agents • Currently qualitative • Flare phenomena • Contrast-enhanced CT • Perfusion CT • Density/enhancement signal changes • Dynamic contrast-enhanced MRI / Diffusion imaging • Positron emission tomography with CT
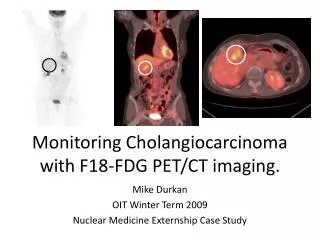
Treatment response to imatinib • Before treatment • 1 month after imatinib initiation Van Den Abbeele AD, The Oncologist 2008; 13: 8-13
Rapid response assessment to therapy Baseline 1 cycle 4 cycles
Rapid response assessment to therapy Baseline 1 cycle 4 cycles
False Positive Residual MassNon seminomatous GCT Before chemotherapy GCT with bulky mets After chemotherapy Mild-moderate residual uptake After surgery Path: granulomatous inflammation
Recurrent Ovarian Cancer 12/98 03/99 01/00 09/00
Treatment Response Assessment in Breast Cancer 02/2002 06/2002 Lack of treatment response documented by PET after chemotherapy
Timing of the treatment response Couturier O et al., Clin Canc Res 2006; 12:6437-6443
Predictive value of FDG-PET 21 days after cycle 3 21 days after cycle 1 Couturier O et al., Clin Canc Res 2006; 12:6437-6443
Radiotracers of interest in oncology From: Wester, HJ. Nuclear Imaging Probes: from Bench to Bedside. Clin Cancer Res 2007;13(12): 3470-3481
Avβ3 integrin imaging with 18F-RGDto predict/monitor anti-VEGF therapy Beer AJ et al., J Nucl Med 2008; 49:22-29.
Estrogen Receptor Imaging in Metastatic Breast Cancer FDG FES
Measuring response to hormone therapy Baseline After 2 months (aromatase inhibitor)
Estrogen challenge to predict resistance to hormone therapy • Baseline FDG-PET • Repeated after 3 x 10 mg doses of estradiol q 8-10h • If increase in FDG uptake < 12% after estradiol administration, this was predictive of hormone therapy failure Dehdashti F et al., Breast Cancer Res Treat 2009; 113: 509-17
Role vs other predictors • Tumor microarrays (DNA, RNA, microRNA) or IHC/FISH panels can provide information about expression of genes/proteins associated with resistance • No « pattern » is entirely predictive • Combining genetic predictors with rapid imaging assay of treatment failure could be a powerful way to identify resistance • Rapidly select patients for phase II clinical trials or tissue banking
Increased Efflux • P-glycoprotein substrates • [99mTc]-Sestamibi • [11C]-Verapamil • [11C]-carvedilol • [11C]N-Desmethyl-Loperamide • [11C]daunorubicin • 4-[18F]Fluoropaclitaxel • Common problem: low tumour uptake / constrast
Chemotherapy influx • Can chemotherapy response be predicted by tracers with similar uptake mechanisms? • Cationic organic transporters • Anionic transporters • Other ions?
Folate receptor mediated transport 99mTc-EC20 Folate receptor scintigraphy. Fisher RE et al., J Nucl Med 2008; 49:899-906
Zr-89 CetuximabDisparity between WB receptor expression and antibody uptake Aerts HJWL et al., J Nucl Med 2009; 50: 123-131
18F-Labeled HER2-Affibody Kramer-Marek et al., Eur J Nucl Med Mol Imag 2008; 35:1008-1018; NIH, Bethesda, MD
Conclusion • PET/CT imaging offers unique new opportunities to predict or rapidly identify treatment resistance • In vivo targeted imaging • Radiopharmaceuticals to predict chemotherapy influx / efflux ? • Possible role for combining predictive biomarkers (DNA/RNA microarrays) and early response imaging to identify resistance