Download
1 / 18
180 likes | 324 Vues
Sediment Depth Analysis and benthic Macro-invertebrate. Blue Lake R.V. Resort Samuel Torp , Simon Peterson, and Suzette Frazier. Photo by Steve Johnson. Outline . Objectives Methods and Materials Results Conclusion & Management Options Limitations. Objectives.

E N D
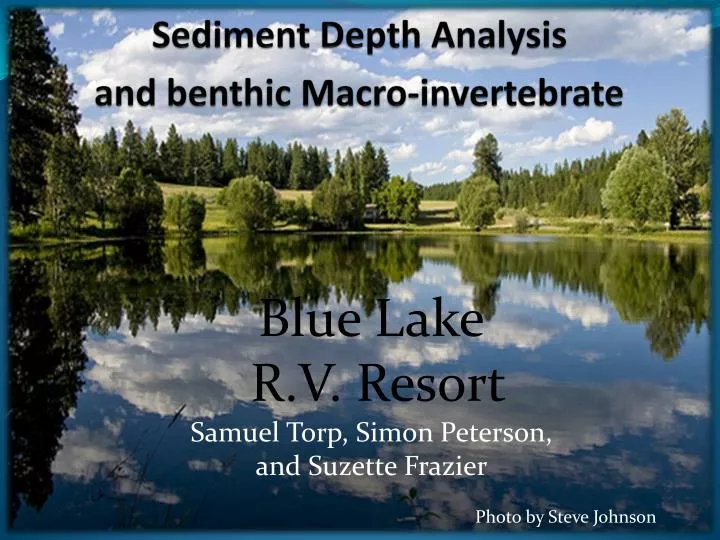
Sediment Depth Analysis and benthic Macro-invertebrate Blue Lake R.V. Resort Samuel Torp, Simon Peterson, and Suzette Frazier Photo by Steve Johnson
Outline • Objectives • Methods and Materials • Results • Conclusion & Management Options • Limitations
Objectives 1) Analyze water and organic content of the sediment at different depths of the lake 2) Analyze benthic invertebrate diversity at different depths of the lake
Hypothesis 1) • There is higher water and organic content in the littoral zone due to higher productivity of benthic invertebrates. 2) • There is a higher species diversity in the littoral zone due to higher organic and water content in sediment and river outlet.
Methods In order to accurately compare littoral zone with center of lake samples were taken in a transect from the river outlet to the center of the lake: Transect: Littoral Zone at 10m Mid lake 20m Lake center 30m Source: Google Maps, http://maps.google.com. Retrieved: 12/06/10
Samples At each of the sample site the following measurements were taken: • Triplicate samples were taken using Ekman grab to analyze benthic invertebrates • One core sample from each site A, B, C taken using K-B core sampler K-B Core sampler (Hoskin, 2010) Ekman Grab (Hoskin, 2010)
Materials and Instruments Instruments: Ekman Grab K-B Core sampler Materials: • Bucket (to hold core samples) • Sample jars (contain Ekman invertebrate samples) • Tape measure (measure out transect) • Screen to filter Ekman grab samples • Core tubes • Stoppers (for core tubes) • Filter Screen (for Ekman samples) • Label Tape
Sample: Lab Analysis K-B core: The cores were segmented into different layers coinciding with visual layer as much as possible • Wet weight was measured as raw sample • Dry weight (after 60˚c degrees for 24hrs) • Ash weight (550˚c for 3hrs) Wet weight-Dry weight= water content Dry weight – Ash weight=organic content Ash weight=mineral content
Sample: Lab Analysis continue… Ekman Grab samples: • Filtered through sieve • Number of macroinvertebrates counted using microscope • Back-track volumes with numbers found to indicate invertebrate densities
Results (Sediment depth) • Figure 1. Sediment composition near the shoreline (group X), Bonners Ferry, ID, USA, 11/30/10.
Sediment depth at 20 meters Figure 2. Sediment composition at 20 meters from the shore, Blue Lake, Bonners Ferry, ID, USA, 11/30/10.
Sediment Compostion at 30 meters, deep lake site Figure 3. Sediment composition at 30 meters (deep lake) site, Blue Lake, Bonners Ferry, ID, USA, 11/30/10
Results (Macroinvertebrates) Fig 10 . Population densities at 10, 20 and 30 meters from the shoreline, Blue Lake, Bonners Ferry, ID, USA, 11/30/10. • We found fresh water clams (Mollusks), abundant snails (Gastropoda), mussel shrimp eggs • (Ostracoda) and beetles (Coleoptera). • Each species has the potential to perform an essential role in the • persistence of the community & the ecosystem; some represent a particular functional • group (Covich et al. 1999). • Availability of food materials govern the distribution of benthic communities • (Saether O.A 1979)
Macroinvertebrate T-test A t-test was run against the triplicate samples taken from the 5m and 30m sites. Three of the most abundant species were compared. All of the t-stat values were less than 0.05 indicating a significant difference. Overall the data on macroinvertebrates was insignificant due to the lack of data.
Discussion • Incorporating phosphorus, nitrogen, and chlorophyll data would be needed to assess ecosystem health. (Kane et al. 2009) • In freshwater sediments benthic invertebrates are often patchily distributed and relatively difficult to sample especially when they live in deep subsurface sediments. • Shannon – Weaver Diversity • There appears to be a significant difference in the total number of macroinvertebrates at the three location. • However the when comparing the data using t-test this indicates that the values are insignificant. • This may be due to the lack of data
Conclusion • Sediment accumulation could be greatest at the middle depth (shelf). This might be due to contribution from the piece of land in the middle, in addition to those from the shore • Organic matter is the greatest contributor to the sediment accumulation • Macroinvertebrate community is dominated by Mollusks, Gastropoda, Ostrocoda, and Coleptera.
Limitations & Options • Further investigation with replicate samples are needed to insure the precision of the data. • Labels that resist high temperature are recommended, this limited the reproducibility of our samples. • The benthic community is a reflection of the biotic/abiotic factors of Blue Lake. • More samples over a larger area would strengthen the data
Reference List • Covich A. P.; Palmer M. A.; Crowl T. A. The Role of Benthic Invertebrate Species in Freshwater Ecosystems: Zoobenthic species influence energy flows and nutrient cycling. BioScience, Volume 49, Number 2, 1 February 1999, pp. 119-127. • Saether, Ole A. Chironomid communities as water quality indicators Ecography Volume 2 Issue 2, Pages 65 – 74. Published Online: 30 Jun 2006 • Kane, Douglas D et al. The Planktonic Index of Biotic Integrity (P-IBI): An approach for assessing lake ecosystem health. Ecological Indicators; Nov 2009, Vol. 9 Issue 6, p1234-1247, 14p