Download
1 / 1
10 likes | 116 Vues
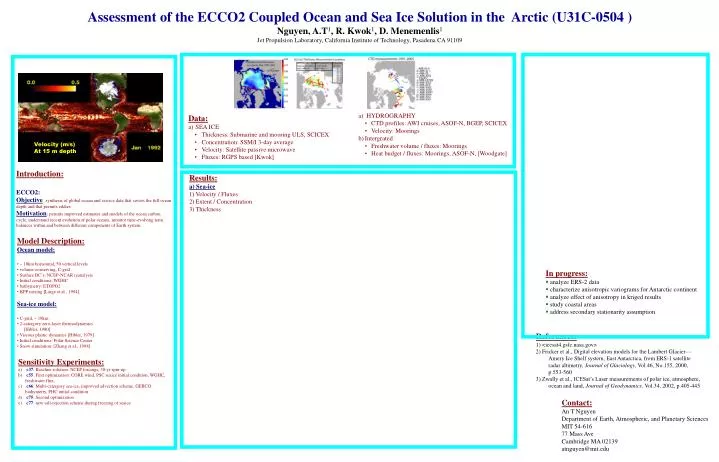
Velocity (m/s) At 15 m depth. Assessment of the ECCO2 Coupled Ocean and Sea Ice Solution in the Arctic (U31C-0504 ) Nguyen, A.T 1 , R. Kwok 1 , D. Menemenlis 1 Jet Propulsion Laboratory, California Institute of Technology, Pasadena CA 91109. HYDROGRAPHY

E N D
Velocity (m/s) At 15 m depth Assessment of the ECCO2 Coupled Ocean and Sea Ice Solution in the Arctic (U31C-0504 ) Nguyen, A.T1, R. Kwok1, D. Menemenlis1 Jet Propulsion Laboratory, California Institute of Technology, Pasadena CA 91109 • HYDROGRAPHY • CTD profiles: AWI cruises, ASOF-N, BGEP, SCICEX • Velocity: Moorings • Intergrated • Freshwater volume / fluxes: Moorings • Heat budget / fluxes: Moorings, ASOF-N, [Woodgate] • Data: • SEA ICE • Thickness: Submarine and mooring ULS, SCICEX • Concentration: SSM/I 3-day average • Velocity: Satellite passive microwave • Fluxes: RGPS based [Kwok] Introduction: ECCO2: Objective:synthesis of global-ocean and sea-ice data that covers the full ocean depth and that permits eddies Motivation:permits improved estimates and models of the ocean carbon cycle, understand recent evolution of polar oceans, monitor time-evolving term balances within and between different components of Earth system. • Results: • a) Sea-ice • Velocity / Fluxes • Extent / Concentration • Thickness • Model Description: • Ocean model: • ~ 18km horizontal, 50 vertical levels • volume-conserving, C-grid • Surface BC’s: NCEP-NCAR reanalysis • Initial conditions: WGHC • bathymetry: ETOPO2 • KPP mixing [Large et al., 1994] • Sea-ice model: • C-grid, ~ 18km • 2-catergory zero-layer thermodynamics [Hibler, 1980] • Viscous plastic dynamics [Hibler, 1979] • Initial conditions: Polar Science Center • Snow simulation: [Zhang et al., 1998] • In progress: • analyze ERS-2 data • characterize anisotropic variograms for Antarctic continent • analyze effect of anisotropy in kriged results • study coastal areas • address secondary stationarity assumption References: 1) <icesat4.gsfc.nasa.gov> 2) Fricker et al., Digital elevation models for the Lambert Glacier— Amery Ice Shelf system, East Antarctica, from ERS-1 satellite radar altimetry, Journal of Glaciology, Vol.46, No.155, 2000, p.553-560 3) Zwally et al., ICESat’s Laser measurements of polar ice, atmosphere, ocean and land, Journal of Geodynamics, Vol.34, 2002, p.405-445 • Sensitivity Experiments: • c37: Baseline solution: NCEP forcings, 30-yr spin-up • c55: First optimization: CORE wind, PSC seaice initial condition, WGHC, freshwater flux, • c66: Multi-catergory sea-ice, improved advection scheme, GEBCO bathymetry, PHC initial condition • c75: Second optimization • c77: new salt-rejection scheme during freezing of seaice Contact: An T Nguyen Department of Earth, Atmospheric, and Planetary Sciences MIT 54-616 77 Mass Ave Cambridge MA 02139 atnguyen@mit.edu