Download
1 / 16
160 likes | 168 Vues
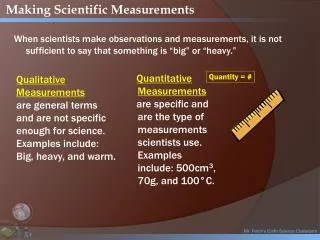
How good are our measurements?. The last three lectures were concerned with some basics of psychological measurement: What does it mean to quantify a psychological variable? How do we operationally define both observable and latent variables?

E N D
How good are our measurements? • The last three lectures were concerned with some basics of psychological measurement: What does it mean to quantify a psychological variable? How do we operationally define both observable and latent variables? • The next important issue concerns the quality of our measurements • How can we help make our measurements precise? • How can we determine whether we’re measuring what we think we’re measuring?
Reliability • Reliability: the extent to which measurements are free of random errors • Random error: nonsystematic mistakes in measurement • misreading a questionnaire item • observer looks away when coding behavior • nonsystematic misinterpretations of a behavior
Reliability • What are the implications of random measurement errors for the quality of our measurements?
Reliability • O = T + E + S O = a measured score (e.g., performance on an exam) T = true score (e.g., the value we want) E = random error S = systematic error • O = T + E (we’ll ignore S for now, but we’ll return to it later)
Reliability • O = T + E • The error becomes a part of what we’re measuring • This is a problem if we’re operationally defining our variables using equivalence definitions because part of our measurement is based on the true value that we want and part is based on error. • Once we’ve taken a measurement, we have an equation with two unknowns. We can’t separate the relative contribution of T and E. 10 = T + E
Reliability: Do random errors accumulate? • Question: If we sum or average multiple observations, will random errors accumulate?
Reliability: Do random errors accumulate? • Answer: No. If E is truly random, we are just as likely to overestimate T as we are to underestimate T. • Height example
Reliability: Do random errors accumulate? Note: The average of the seven O’s is equal to T
Reliability: Implications • These demonstrations suggest that one important way to help eliminate the influence of random errors of measurement is to use multiple measurements. • operationally define latent variables via multiple indicators • use more than one observer when quantifying behaviors
Reliability: Estimating reliability • Question: How can we estimate the reliability of our measurements? • Answer: Two common ways: (a) test-retest reliability (b) internal consistency reliability
Reliability: Estimating reliability • Test-retest reliability: Reliability assessed by measuring something at least twice at different time points. • The logic is as follows: If the errors of measurement are truly random, then the same errors are unlikely to be made more than once. Thus, to the degree that two measurements of the same thing agree, it is unlikely that those measurements contain random error.
Reliability: Estimating reliability • Internal consistency: Reliability assessed by measuring something at least twice within the same broad slice of time. Split-half: based on an arbitrary split (e.g, comparing odd and even, first half and second half) Cronbach’s alpha (): based on the average of all possible split-halves
Less error More error Item A 4 3 Item B 5 5 Item C 6 7 Item D 5 5 4 3 Item E Item F 5 5 Items A, B, & C yield an average score of (3+5+7)/3 = 5. Items A, B, & C yield an average score of (4+5+6)/3 = 5. Items D, E, & F yield an average scores of (5, 3, 5)/3 = 4.3. Items D, E, & F yield an average scores of (5, 4, 5)/3 = 4.6. These two estimates are off by only .4 of a point. These two estimates are off by .7 of a point.
Reliability: Final notes • An important implication: As you increase the number of indicators, the amount of random error in the averaged measurement decreases. • An important assumption: The entity being measured is not changing. • An important note: Common indices of reliability range from 0 to 1; higher numbers indicate better reliability (i.e., less random error).