Download
1 / 27
270 likes | 391 Vues
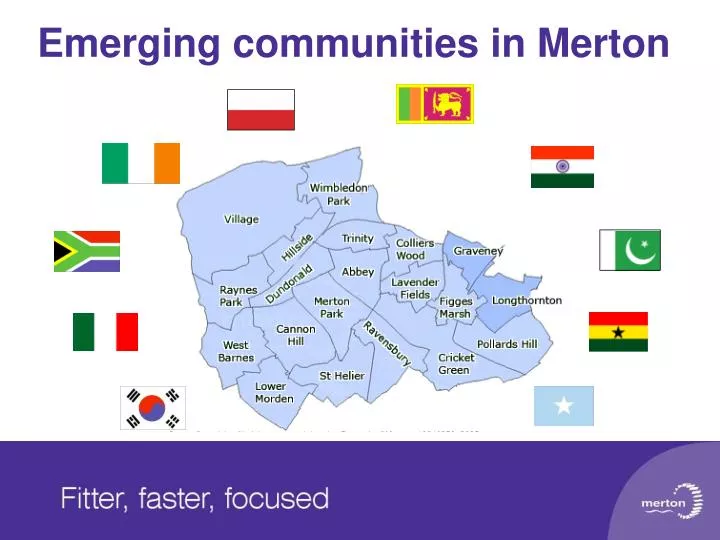
Emerging communities in Merton. 2001 Census population 187908 9 th smallest population in London. Merton Population Profile. Population density similar to Ealing, Brent, Waltham Forest, Newham. Less density than inner London partly due to commons and parks.

E N D
2001 Census population 187908 • 9th smallest population in London Merton Population Profile • Population density similar to Ealing, Brent, Waltham Forest, Newham. • Less density than inner London partly due to commons and parks Source 2001 Census http://www.statistics.gov.uk/
Multiple Deprivation Census Profile • Merton 75% White, 11% Asian, 8% Black London 71% White, 12% Asian 11% Black. • In parts of east Merton up to 50% of residents have an ethnic minority background. • 74% Born in UK - 26% born overseas • 14% have a disability or limiting long term illness, • 17% are aged over 60, • 19% are under 16 years old. • Life expectancy is 5.2 years more in top 4 wards than bottom 4 wards Population density
Population Estimates Census 187908 • ONS 2005 mid year estimates 1947003.6% increase Assumption 900 net migration Data Management and Analysis Group GLA • higher estimate 195557 4.1% increase • lower estimate 192220 2.3% increase ONS 2007 projection grant allocation 195464 4% increase • assumptions about births deaths and national and international migration
Population Estimate Methodology - + 2001 Census Births Deaths + - + International Migration International Passenger Survey National Migration GP registrations Sources of inaccuracy Visitor Switchers
Local Knowledge • Electoral register • GP registrations • National Insurance registrations • Languages in schools • Translation Service
Electoral register • Local data suggests our population may be higher • Electoral register 2002 134484 • Electoral register 2006 137374 • 2.15% increase between 2002 – 2006 • 2001 Census x 2.15% = 191946.1
GP Registrations • GP registrations 2001 188814 • GP registrations 2007 216725 12.6% increase • But some people stick with their GP even if the emigrate • Some people think they have to pay so use A&E instead • Young men often don’t register
National Insurance registrations • Registrations from non-UK nationals risen from 3590 in 2003/04 to 6470 in 2005/06 • making a total of 18100 extra people. • If these are added to the 2001 census • Merton’s population would be 206008 • 9% higher than the census. Source: Department Work and Pensions
National Insurance registrations by constituency Source: Department Work and Pensions
Languages in schools • Children in Merton schools who are exposed to a non-English language at home.(n.b. language not ethnicity) • Rise from 5410 to 6849 27% rise • Includes 249% rise in Polish speaking children. • If these extra 1439 children are added to the children in the census the local estimate for children is 38013 • This compares with 36547 in the census
National Insurance registrations plus non English speaking children
Combining local knowledge Estimate % increase • Electoral register 191946 - 2.15% • National Insurance registrations 206008 - 9% • National Insurance + Children 207447 - 10.4% • GP registrations - 216725 - 12.6% • Approximate figure - 207447 - 10.4% • Our population may be underestimated by 11000
Languages other than English used in Merton Schools 2003 to 2007
Electoral registerSouth Africa and Poland South Africa Poland
Electoral register Sri Lanka Sri Lanka
Electoral register Ireland and Ghana Ghana Ireland
Electoral register India, Pakistan India Pakistan
Further Questions • Does this seem accurate? • What other local information do we have?