Download
1 / 25
250 likes | 373 Vues
CFU R common diagnostics. CFU_load. CFU_season. CFU_trend. CFU_clim. CFU_ano. CFU_anocrossvalid. CFU_smoothing. CFU_plotclim. CFU_animvsltime. CFU_plotano. CFU R common diagnostics. CFU_load. Minimum set of arguments :

E N D
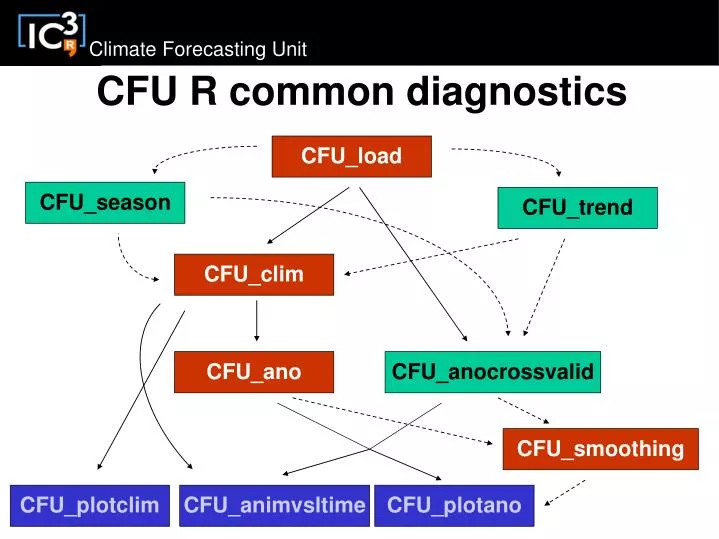
CFU R common diagnostics CFU_load CFU_season CFU_trend CFU_clim CFU_ano CFU_anocrossvalid CFU_smoothing CFU_plotclim CFU_animvsltime CFU_plotano
CFU R common diagnostics CFU_load Minimum set of arguments : 1) var 2) exp 3) obs (can be obs=NULL) 4) sdates You can request a subset of leadtimes You can work on a subdomain by providing lat/lon borders You can request area-averages, longitudinal or latitudinal averages, 2d fields You can define any region by sending masks
CFU R common diagnostics CFU_season This function computes averages over extended season. It can be used to compute annual means for exemple.
CFU R common diagnostics This function computes per-pair climatologies, one climatology per member or one for all the members together. CFU_clim If you have only one start date, your climatology should be computed as a simple annual cycle not with CFU_clim. If you don’t have observations, you don’t need the per-pair method. Your clim is clim=CFU_mean1dim(exp, 3)
CFU R common diagnostics This function computes anomalies using the cross-validation method, i.e. for each startdate, the climatology is computed using all the other startdates. It also uses the per-pair method. CFU_anocrossvalid
CFU R common diagnostics CFU_trend This function provides not only the linear trend but also the linearly detrended data.
CFU R common diagnostics CFU_load mod = array(dim=c(nexp, nmemb, nsdates, nltimes) to mod = array(dim=c(nexp, nmemb, nsdates, nltimes, nlat, nlon) CFU_clim Those functions work only with the common diagnostic structure. CFU_ano CFU_anocrossvalid obs = array(dim=c(nobs, nmemb, nsdates, nltimes) to obs = array(dim=c(nobs, nmemb, nsdates, nltimes, nlat, nlon) CFU_plotclim CFU_animvsltime CFU_plotano
CFU R common diagnostics Forthose functions, the input structure is free. Input matrix can have any number of dimensions and the dimension along which the trend, smoothing or season has to be computed should be specified. Default parameters : common diagnostic structure, leadtime dimensions for CFU_season/CFU_smoothing, nsdates for CFU_trend CFU_season CFU_trend CFU_smoothing You can use them on any time series
CFU R common diagnostics CFU_load CFU_season CFU_trend CFU_clim CFU_ano CFU_anocrossvalid CFU_smoothing CFU_plotclim CFU_animvsltime CFU_plotano
CFU R common diagnostics CFU_ano CFU_anocrossvalid CFU_spread CFU_trend CFU_corr CFU_consist_trend CFU_RMS CFU_ratioRMS CFU_RMSSS CFU_ratioSDRMS CFU_plotvsltime CFU_animvsltime CFU_plotequimap
CFU R common diagnostics Forthose functions, the input structure is free. Default : common diagnostic structure CFU_spread CFU_trend CFU_corr CFU_RMS CFU_ratioRMS CFU_RMSSS CFU_ratioSDRMS Scores are computed for each experimental dataset versus each observational dataset in your input matrix.
CFU R common diagnostics CFU_ano CFU_anocrossvalid Those functions expect the common diagnostic structure CFU_consist_trend CFU_plotvsltime CFU_animvsltime
CFU R common diagnostics For this function, (lat,lon) expected and a second matrix of flags=T/F with the same dimensions is expected for significance level It has many functionalities to make nice plots for publication. Color levels (square or smoothed), contours, dots …, continents can be filled in grey or show as black lines. Colorbar can be drawn or not…. It can be used in a multipanel after splitting the space with layout CFU_plotequimap
CFU R common diagnostics Confidence intervals or significance levels or both are systematically provided. CFU_spread CFU_trend CFU_corr CFU_consist_trend CFU_RMS CFU_ratioRMS CFU_RMSSS CFU_ratioSDRMS
CFU R common diagnostics For those functions, there are issues about the temporal dependance of the data for confidence intervals/significance levels. For non-parametric tests, a window of dependence has to be defined, for parametric ones, a number of independant data has to be defined. CFU_corr CFU_RMS CFU_ratioRMS CFU_RMSSS CFU_ratioSDRMS Those functions currently use parametric tests with a number of independant data defined following the classical formula from Von Storch and Zwiers (2001). This might change depending on the literature. Call to CFU_eno
CFU R common diagnostics bootstrap T- distribution one sided T-test Fisher transform CFU_spread CFU_trend chi2 CFU_corr CFU_consist_trend CFU_RMS CFU_ratioRMS CFU_RMSSS CFU_ratioSDRMS two-sided Fisher test one-sided Fisher test one-sided Fisher test
CFU R common diagnostics CFU_ano CFU_anocrossvalid CFU_spread CFU_trend CFU_corr CFU_consist_trend CFU_RMS CFU_ratioRMS CFU_RMSSS CFU_ratioSDRMS CFU_plotvsltime CFU_animvsltime CFU_plotequimap
CFU R common diagnostics CFU_eno CFU_meanlistdim Forthose functions, the input structure is free. CFU_mean1dim CFU_insertdim This function makes a colorbar if you send the levels and colors. Useful for multipanels after calling layout CFU_colorbar
CFU R common diagnostics • [vguemas@bor ~]$ R • source(‘/cfu/pub/scripts/R/common_diagnostics.txt’) • [1] List of functions : • [1] • [1] CFU_load • [1] CFU_season • [1] CFU_clim • [1] CFU_ano • [1] CFU_ano_crossvalid • [1] CFU_smoothing • [1] CFU_plotano • [1] CFU_plotclim • [1] CFU_spread • [1] CFU_plotvsltime • [1] CFU_corr • [1] CFU_RMS • [1] CFU_RMSSS
CFU R common diagnostics • [1] CFU_ratioRMS • [1] CFU_ratioSDRMS • [1] CFU_trend • [1] CFU_consist_trend • [1] CFU_plotequimap • [1] CFU_colorbar • [1] CFU_animvsltime • [1] CFU_eno • [1] CFU_enlarge • [1] CFU_insertdim • [1] CFU_mean1dim • [1] CFU_meanlistdim • [1] CFU_inilistdims • [1] • [1] For more information about any function, type info_cd('function name') • info_cd(‘CFU_load’)
CFU R common diagnostics [1] [1] Description [1] ~~~~~~~~~~~~~ [1] [1] Load experimental data and corresponding observed ones in 2 matrix with similar structures [1] If loading EC-Earth experiments, PUT FIRST THE EXPERIMENT ID WITH THE LARGEST NUMBER [1] OF MEMBERS & if possible, THE LARGEST NUMBER OF LEADTIMES. If not possible, fill up the nleatime argument. [1] [1] Inputs [1] ~~~~~~~~ [1] [1] - var= 'tas','prlr','tos','g500','g200','ta50','psl','hflsd','hfssd','rls','rss','rsds','uas','vas'
CFU R common diagnostics [1] - exp=c('ecmwf','ukmo','cerfacs','ifm','DePreSysAsimDec','DePreSysNoAsimDec','DePreSysAsimSeas','ECMWF_S3Seas','ECMWF_S4Seas','ECMWF_S4SeasQWeCI','hadcm3dec','miroc4dec','miroc5dec','mri-cgcm3dec','cancm4dec1','cancm4dec2','cnrm-cm5dec','knmidec','mpimdec','gfdldec','cmcc-cmdec','hadcm3his','miroc4his','miroc5his','mri-cgcm3his','cancm4his','cnrm-cm5his','knmihis','i00k','b013','b014','yve2' ...) [1] - obs=c('ERA40','NCEP','ERAint','GHCN','ERSST','HADISST','GPCP','GPCC','CRU','DS94','OAFlux','DFS4.3','NCDCglo','NCDCland','NCDCoc','GISSglo','GISSland','GISSoc','HadCRUT3glo','HadSST2oc','CRUTEM3land') [1] - sdates=c('YYYYMMDD','YYYYMMDD') [1] - lonmin, lonmax, latmin, latmax : domain border 0 <= lonmin,lonmax <= 360 [1] default : world [1] - nleadtime : optional argument needed only if the first exp does not have the largest number of leadtimes. [1] default : number of leadtimes of the first experiment.
CFU R common diagnostics [1] - leadtimemin : output only the leadtimes from leadtimemin. default = 1 [1] - leadtimemax : output only the leadtimes before leadtimemax. default = nleadtime [1] - output = 'areave' / 'lon' / 'lat' / 'lonlat' [1] 1) Time series of area-averaged variables over the specified domain [1] 2) Time series of meridional averages as a function of longitudes [1] 3) Time series of zonal averages as a function of latitudes [1] 4) Time series of 2d fields [1] default : 'areave' [1] - method = 'bilinear' / 'bicubic' / 'conservative' / 'distance-weighted' [1] Method of interpolation for 'lon' / 'lat' / 'lonlat' output options [1] default : 'conservative' [1] - grid = to choose the output grid [1] possible options : rNXxNY or tTRgrid, ex: r96x72, t106grid [1] default : model grid, argument need to be filled if various exp on various grids
CFU R common diagnostics • [1] - maskmod=list(mask[lon,lat]) = 1/0 : kept/removed grid cell over the entire model domains • [1] Warning : list() compulsory even if 1 model !!! • [1] default : 1 everywhere • [1] - maskobs=list(mask[lon,lat]) = 1/0 : kept/removed grid cell over the entire • [1] observed domains, only necessary for 'areave' output option • [1] Warning : list() compulsory even if 1 dataset !!! • [1] default : 1 everywhere • [1]
CFU R common diagnostics • [1] Outputs • [1] ~~~~~~~~~ • [1] • [1] $mod = model outputs • [1] $obs = observations • [1] $lat = latitudes of the model grid • [1] $lon = longitudes of the model grid • [1] • [1] 2 matrix with dimensions • [1] c(nmod/nexp or nobs, nmemb/nparam, nsdates, nltime) if output = 'areave' • [1] c(nmod/nexp or nobs, nmemb/nparam, nsdates, nltime, nlat ) if = 'lat' • [1] c(nmod/nexp or nobs, nmemb/nparam, nsdates, nltime, nlon ) if = 'lon' • [1] c(nmod/nexp or nobs, nmemb/nparam, nsdates, nltime, nlat, nlon) = 'lonlat' • [1] • [1] Author • [1] ~~~~~~~~ • [1] • [1] CFUers <vguemas@ic3.cat> March 2011