Download

1 / 66
670 likes | 794 Vues
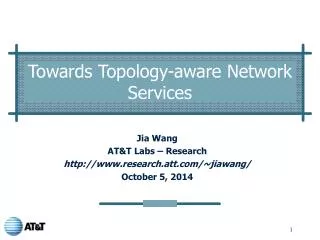
Towards Highly Reliable Enterprise Network Services via Inference of Multi-level Dependencies. Defense by Chen, Jiazhen & Chen, Shiqi. Introduction. Using a network-based service can be a frustrating experience….

E N D
Towards Highly Reliable Enterprise Network Services via Inference of Multi-level Dependencies Defense by Chen, Jiazhen & Chen, Shiqi
Introduction • Using a network-based service can be a frustrating experience… Even inside the network of a single enterprise, where traffic does not cross the open Internet, user-perceptible service degradations are rampant.
Introduction When 13% of the requests take 10x longer than normal and acceptable time to process, it’s time for us to do something.
Introduction • Conventional approach: up OR down • Our approach: up, troubled or down. Response fall significantly outside of normal response time, including the case when only a subset of service requests are performing poorly.
Sherlock • Detects the existence of faults and performance problems by monitoring the response time of services. • Determines the set of components that could be responsible. • Localizes the problem to the most likely component.
Inference Graph and Ferret Algorithm • Inference Graph: Captures the dependencies between all components of the IT infrastructure. Determine the set of component • Ferret Algorithm: Efficiently localizes faults in enterprise-scale networks using the Inference graph and measurements of service response times made by agents. Localize the problem to the most likely component
Tradeoffs • Sherlock falls short of full problem diagnosis. • It has not been evaluated in an environment that dependencies are deliberately and frequently changed. • … • BUT, measurements indicate that the vast majority of enterprise applications do not fall into these classes.
Node structure • Root-cause node: physical components whose failure can cause an end-user to experience failures. (two special root-cause nodes: AT and AD) • Observation node: accesses to network services whose performances can be measured by Sherlock. • Meta-nodes: model the dependencies between root causes and observations.
Node State • The state of each node is expressed by a three-tuple: (Pup, Ptrouble, Pdown) • Pup +Ptrouble + Pdown = 1 • The state of the root-cause node is independent of any other node in the Inference Graph.
Edges • Edge from node A to B: the dependency that node A has to be in the up state for node B to be up. • Each edge is given a dependency probability, indicating how strong the dependency is.
Meta-Nodes and the Propagation of State Noisy-Max Meta-Nodes • Max: The node gets the worst condition of its parents. • Noisy: if the weight of a parent’s edge is d, then with probability (1-d) the child is not affected by that parent.
Meta-Nodes and the Propagation of State Selector Meta-Nodes • Used to model load balancing scenarios. • NLB: Network Load Balancer • ECMP: A commonly used technique in enterprise networks where routers send packets to a destination along several paths.
Meta-Nodes and the Propagation of State Failover Meta-Nodes • Failover: Clients access primary production servers and failover to backup servers when the primary server is inaccessible.
Calculation of State Propagation For Noisy-Max Mega-Nodes: Time Complexity: O(n) instead of O(3n).
Calculation of State Propagation For Selector and Failover meta-nodes: • Still needs O(3n) time. • HOWEVER, those two types of meta-nodes have no more than 6 parents.
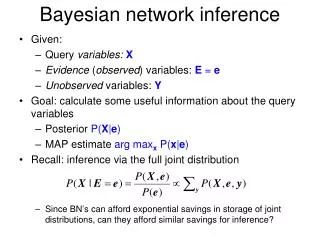
Fault Localization • Assignment-vector: An assignment of state to every root-cause node in the Inference Graph where the root-cause node has probability 1 of being either up, troubled or down. • Our target: Find the assignment-vector that can explain the observation best.
Ferret Algorithm • Basically we need to compute a score for how well the vector explains the observations for EACH vector, and give the most possible results in sorting order. • But there are 3r possible vectors for r root-cause nodes, how to search through all these vectors?
Ferret Algorithm • IMPORTANT OBSERVATION: It is very likely that at any point in time only a few root-cause nodes are troubled or down. • Ferret Algorithm evaluates the vectors with no more than k nodes troubled or down. So it processes at most (2*r)k vectors.
Ferret algorithm • The approximation error of Ferret algorithm becomes vanishingly small for k=4 and onwards
Ferret Algorithm • OBSERVATION: Since a root-cause is assigned to be up in most assignment vectors, the evaluation of an assignment vector only requires re-evaluation of states at the descendants of root-cause nodes that are not up. • So Ferret Algorithm can be further speeded up.
Ferret Algorithm Score for a given assignment vector: • Track the history of response time and fits two Gaussian distribution to the data, namely Gaussianup and Gaussiantroubled. • If the observation time is t and the predicted observation node is (pup, ptroubled, pdown), then the score of this vector is calculated as: pup*Prob(t|Gaussianup) + ptroubled*Prob(t|Gaussiantroubled)
Ferret Algorithm • We use a statistical test to determine if the prediction is sufficiently meaningful to deserve attention. • Null hypothesis: all root causes are up • Score(best prediction) – Score(null hypothesis)
The Sherlock System Step1: Discover Service-Level Dependencies Step2: Construct the Inference Graph Step3: Fault Localization using Ferret Remark: Sherlock requires no changes to routers, applications, or middlewares used in the enterprise.
Discovering Service-Level Dependencies • OBSERVATION: If accessing service B depends on service A, then packets exchanged with A and B are likely to co-occur. • Dependency probability: conditional probability of accessing service A within the dependency interval, prior to accessing service B. • Dependency interval: 10ms • Chance of co-occurrence: 10ms/I. We retain only the dependency probability which is much greater than the chance of co-occurrence.
Aggregating Probabilities across Clients • OBSERVATION: many clients in an enterprise network have similar host, software and network configuration and are likely to have similar dependencies. • Aggregation allows us to deal with infrequent service and false dependencies better.
Constructing the Inference Graph A: Create a noisy-max meta-node to represent the service. And create an observation node for each client.
Constructing the Inference Graph B: Identify the set of services Ds that the clients are dependent on accessing S. And recurs.
Constructing the Inference Graph C: Create a root-cause node to represent the host on which the service runs and makes this root-cause a parent of the meta-node.
Constructing the Inference Graph D: Add network topology information to the Inference Graph. Add a noisy-max meta node to represent the path and a root-cause nodes to represent router and link.
Constructing the Inference Graph E: Finally put AT and AD into the Inference Graph. Give each the edges connecting AT/AD to the observation point a weight 0.001. And give the edges between a router and a path meta-node a probability 0.999.
Implementation • Implement Sherlock Agent as user-level daemon • Windows XP • Pcap-based sniffer
Implementation • Centralized inference Engine • Aggregate information easily • Scalability • Extremely large network (105 agents) – bandwidth Req.10Mbps
Implementation • Computational Complexity of fault localization • Linearly with graph size
Evaluation • Deploy Sherlock system in our enterprise network • 40 servers • 34 routers • 54 IP links • 2 LANs • 3 Weeks • Agents periodically send requests to the web and file servers • Mimic user behavior • Controlled environments: Testbed and simulation
Evaluation – Discovering Service Dependencies • Evaluate Sherlock’s algorithm • discovering Service-level dependency graphs • Two example: • Web Server • File Server • In the graph: • Arrows: • Point from server provides service to server rely on it. • Edges : • Represent strength of the dependencies with weights
Evaluation – Discovering Service Dependencies • Service-level dependency graphs for visiting web portal and sales website • Clients depend on name lookup servers to access websites • Both websites share substantial portions of their back-end dependencies
Evaluation – Discovering Service Dependencies • Service-level dependency graphs for visiting file server • Turns out file server is the root name of a distributed file system
Evaluation – Discovering Service Dependencies • Summary • Service-level dependencies is various • Similar dependencies have different strength • Dependencies change over the time
Evaluation – Discovering Service Dependencies • Number of samples • For about 4,000 samples, converged. • Once converged, service-level dependencies are stable over several days to weeks.
Evaluation – Discovering Service Dependencies • Number of clients • Sherlock aggregates samples from more clients • Aggregate 20 clients reduce false-dependency greatly
Evaluation – Localizing Faults • Evaluate “Ferret” • Ability to localize faults • Sensitivity to errors
Evaluation – Localizing Faults • Testbeds • Three web servers, • SQL server, • Authentication server • Failed or Overloaded: • Overloaded link: 5% of packets drop • Overloaded server: high CPU and disk utilization
Evaluation – Inference Graph • Service-level dependencies • Arrows at the bottom level
Features of Ferret • Localizes faults • Correlating observations from multiple points • No “Threshold” setting • Clients observation of web server’s performance • Probabilistic Correlation Algorithm for reasoning • List of suspects of being the root cause • Handle multiple simultaneous failures
Fault Localization Capability • Affected by • The number of vantage points • The number of observations available in time window • Having observations from the same time period that exercise all paths in the Inference Graph.
Fault Localization Capability • In time window of 10 seconds • At least 70 unique clients access every one of the top 20 servers • Top 20 servers alone provide enough observations to localize faults
Evaluation - Sherlock Field Deployment • The resulting Inference Graph contains: • 2565 nodes • 358 components • Can fail independently • Experiment: • Running Sherlock system over 120 hours • Found 1029 performance problems
Evaluation - Sherlock Field Deployment • The result • X: time • Y: one component
Evaluation - Sherlock Field Deployment • Ferret’s computation: • 87% of the problems are caused by 16 components • The Server1, Server2, and Link on R1 for instance