Download
1 / 50
500 likes | 635 Vues
Assessing Ranges and Probabilities. 5. Verify. 4. Assess. 3. Condition. 2. Structure. 1. Motivate. We will discuss quantifying uncertainty with ranges and probabilities. Got it!. ... 30% . Using Probabilities to Communicate Avoiding Biases Developing Assessments.

E N D
5. Verify 4. Assess 3. Condition 2. Structure 1. Motivate We will discuss quantifying uncertainty with ranges and probabilities. Got it! ... 30% ... • Using Probabilities to Communicate • Avoiding Biases • Developing Assessments The quality of an assessment depends on recognizing biases and compensating for them. 2.08 E • Assessing Ranges & Probabilities
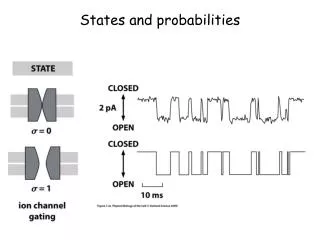
Well, nowit’s 35% It’s 50% I just heard... Probabilities are used to quantify the likelihood of uncertain events. • They are based on judgment, experimental data, or both. Results • They may change with new information. 2.08 E • Assessing Ranges & Probabilities
??? Got it! ... likely ... ... 30% ... 59 Win 80 .7 Buy Lose .3 10 Sell 25 Probabilities are important for two reasons. • They improve communication in the organization. • They facilitate the analysis of decisions involving uncertainty. 2.08 E • Assessing Ranges & Probabilities
Below are several phrases commonly used to express the likelihood that an event will occur. Indicate your range of probabilities (0-1.0) for each phrase. • Using probabilities reduces ambiguity. • Your listener understands you. • But you’ll need to communicate the basis for your judgment. 2.08 E • Assessing Ranges & Probabilities
5. Verify 4. Assess 3. Condition 2. Structure 1. Motivate We will discuss quantifying uncertainty with ranges and probabilities. Got it! ... 30% ... • Using Probabilities to Communicate • Avoiding Biases • Developing Assessments The quality of an assessment depends on recognizing biases and compensating for them. 2.08 E • Assessing Ranges & Probabilities
Motivational Biases There are two classes of biases: cognitive and motivational. Conscious Beliefs Verbal Statements 2.08 E • Assessing Ranges & Probabilities
The possibility of reward or punishment causes motivational bias. Examples: • Salesperson’s Forecast • “Expert’s” Confidence • “Certified” Number 1st Approved 2.08 E • Assessing Ranges & Probabilities
Cognitive Biases We are generally unaware of “cognitive” biases, which distort conscious beliefs. Motivational Biases Conscious Beliefs Available Information Verbal Statements 2.08 E • Assessing Ranges & Probabilities
20 miles When an object can be seen clearly, the brain perceives it as being close. 35 miles When mist obscures details of the object, the brain perceives it as being farther away. Cognitive biases result from the improper use of cognitive “rules of thumb.” Example: Effect of clarity on assessment of distance. 2.08 E • Assessing Ranges & Probabilities
We will demonstrate improper rules of thumb and the associated cognitive biases. • Anchoring and adjustment • Availability • Representativeness • Implicit conditioning Source: A. Tversky and D. Kahneman, “Judgment Under Uncertainty: Heuristics and Biases,” Science, September 27, 1974. 2.08 E • Assessing Ranges & Probabilities
6 Write down your .1 and .9 cumulative probabilities for these uncertain quantities. Question Cumulative Probabilities* .1 .9 1 Year in which Attila the Hun died * Probability that the quantity listed in the 1998 World Almanac will be less than or equal to the value you write down. 2 Number of arrests for auto theft in the United States in 1996 3 United States beef consumption in 1997 4 At its mean distance, number of years it takes Pluto tocircumnavigate the sun 5 Airline distance from Beijing (China) to Moscow (Russia) 2.08 E • Assessing Ranges & Probabilities
Instructors can move the two blue boxes to reveal answers. At its mean distance, number of years it takes Pluto to circumnavigate the sun Scoring Sheet with Answers Uncertain Quantity Answer 453 A.D. 1 Year in which Attila the Hun died 2 Number of arrests for auto theft in the U.S. in 1996 175,400 25,609 million lbs.* 3 U.S. beef consumption in 1997 247.7 years 4 3,607 miles* 5 Airline distance from Beijing (China) to Moscow (Russia) 6 Total Percent *12.8 million US tons; 11.6 million metric tons; 11600 million kg **5,804 kilometers 2.08 E • Assessing Ranges & Probabilities
80% Perfect calibration= 80% 70% 60% Percentage of assessed 10th-90th percentile ranges that contained the almanac facts 50% 40% Average 40% 30% 20% 10% 0% 0 10 20 30 40 50 60 70 80 90 100 110 120 Demonstration Rather than 80% of answers falling inside 10-90 ranges, on average only 40% fall inside. As predicted by Kahneman and Tversky, ranges are too narrow, due to anchoring on an initial assessment and inadequately adjusting for uncertainty in that estimate. 2.08 E • Assessing Ranges & Probabilities
1 Year in which Attila the Hun died 2 Number of arrests for auto theft in the United States in 1996 3 United States beef consumption in 1997 4 Annualized change in health care expenditure 1996-2006 (%/year) 5 % of [your company’s} revenues generated by your unit in 2007 6 [Your company’s] 2007 capital expenditures In 57 demonstrations, we split the questions between “almanac data” and “participant company facts.” Write down your .1 and .9 cumulative probabilities for these uncertain quantities. Cumulative Probabilities* Question .1 .9 Almanac Questions Company Questions * Probability that the quantity listed in the 1998World Almanac or [your company’s] 2007 annual report will be less than or equal to the value you write down. 2.08 E • Assessing Ranges & Probabilities
90% Perfect calibration= 80% 80% 70% Percentage of assessed 10th-90th percentile ranges that contained the company facts 60% 50% Average 43% 40% 30% 20% 10% 0% 0 10 20 30 40 50 60 Demonstration On average, participants had only 3 percent more company facts inside their assessed 10-90 ranges. 2.08 E • Assessing Ranges & Probabilities
3.0 2.5 Ratio of company facts inside the 10-90 range to almanac facts inside the range 2.0 Better Performance on: 1.5 Company Questions Average 1.2 1.0 Almanac Questions 0.5 0.0 0 10 20 30 40 50 60 Demonstration We also recorded the “improvement” from assessing almanac facts to company facts in each demonstration. • While average performance was 20% better on company questions, it was worse in in 22 of 57 demonstrations, illustrating “expert bias” • “I know more about my company than I do about Attila the Hun, so my ranges should be narrower.” 2.08 E • Assessing Ranges & Probabilities
InitialEstimate –25% +25% Anchoring &Adjustment Experts can “anchor” on an initial estimate and “adjust” inadequately for uncertainty. 0 5 10 15 20 25 30 35 40 Plant Lifetime (years) 2.08 E • Assessing Ranges & Probabilities
We will examine four improper rules of thumb and the associated cognitive biases. • Anchoring and adjustment • Availability • Representativeness • Implicit conditioning Source: A. Tversky and D. Kahneman, “Judgment Under Uncertainty: Heuristics and Biases,” Science, September 27, 1974. 2.08 E • Assessing Ranges & Probabilities
Availability Exercise • Instructors: • Distribute Turkey handouts • Once finished, move this box to reveal Turkey answers. In a survey, we used two versions of a questionnaire. Each had an available anchor, which biased the assessment. Population of Turkey What is your probability that the population of Turkey is greater than four million? ______% What is your best estimate of the population of Turkey? ______million Population of Turkey What is your probability that the population of Turkey is greater than 80 million? ______% What is your best estimate of the population of Turkey? ______million 2.08 E • Assessing Ranges & Probabilities
Availability Exercise Instructors can move this grey box to reveal Turkey exercise answers. Population of Turkey 70,586,256 * *Source: 2007 Census - Wikipedia. 2.08 E • Assessing Ranges & Probabilities
8.0 Ratio of average population estimates: 7.0 6.0 Average for participants with “80 million” on the form Average for those with “4 million” on the form 5.0 4.0 3.0 Average = 2.6 2.0 Ratio of 1.0 indicates no difference in average estimates 1.0 0.0 0 10 20 30 40 50 60 70 80 90 100 105 Demonstration Availability Exercise Instructors can move this grey box to reveal Turkey exercise answers. In 105 courses, participants with “80 million” on the form estimated populations 2.6 times higher than those with “4 million.” The “availability” of 4 or 80 million has a dramatic effect on population estimates. Thus, an interview should never suggest a number when assessing quantitative information. 2.08 E • Assessing Ranges & Probabilities
Long-RangePlan Recent Certified Dramatic Chernobyl “R” Imaginable Ordered Availability “The probability of an event goes up in proportion to ‘available’ information.” Characteristics That Make Information Available 2.08 E • Assessing Ranges & Probabilities
We will examine four improper rules of thumb and the associated cognitive biases. • Anchoring and adjustment • Availability • Representativeness • Implicit conditioning Source: A. Tversky and D. Kahneman, “Judgment Under Uncertainty: Heuristics and Biases,” Science, September 27, 1974. 2.08 E • Assessing Ranges & Probabilities
Every case of chicken pox has spots. This guy has spots. He must have chicken pox. Representa-tiveness Representativeness bias arises when general knowledge is not considered logically. Every case of chicken pox has spots. While spots can be associated with (represent) chicken pox, it is generally known that spots have many different causes.Prob. (spots | chicken pox) ¹ Prob (chicken pox | spots) 2.08 E • Assessing Ranges & Probabilities
We will examine four improper rules of thumb and the associated cognitive biases. • Anchoring and adjustment • Availability • Representativeness • Implicit conditioning Source: A. Tversky and D. Kahneman, “Judgment Under Uncertainty: Heuristics and Biases,” Science, September 27, 1974. 2.08 E • Assessing Ranges & Probabilities
No war, no strike, no fire, no flood, no price control, no major equipment failure, no new competitor, …. ImplicitConditioning Implicit conditioning occurs when the expert makes unstated assumptions. Expert Assessor 2.08 E • Assessing Ranges & Probabilities
5. Verify 4. Assess 3. Condition 2. Structure 1. Motivate We will discuss quantifying uncertainty with ranges and probabilities. Got it! ... 30% ... • Using Probabilities to Communicate • Avoiding Biases • Developing Assessments The quality of an assessment depends on recognizing biases and compensating for them. 2.08 E • Assessing Ranges & Probabilities
Failure p Success 1 – p We will describe a systematic procedure for developing assessments. • This procedure is applicable for both quantitative and qualitative assessments. • Assessing a range e.g. Estimate Market share at peak Select the most appropriate analog for your uptake curve • Assessing the discreet probability of an event e.g. Assess the chance of a competitor’s launch Estimate the PTRS of a compound 2.08 E • Assessing Ranges & Probabilities
5. Verify 4. Assess 3. Condition 2. Structure 1. Motivate This five-step assessment procedure aims to minimize biases This procedure is independent of the source of information. It can be applied in client / expert assessment interviews as well as on yourself when you as a consultant are responsible for making assessments. 2.08 E • Assessing Ranges & Probabilities
5. Verify 4. Assess • Explain importance. • Emphasize communication. • Explore stake in decision. 1. Motivate 3. Condition 2. Structure 1. Motivate The first step aligns all participants in the answer to “Why do we care to assess this?” • The duration/depth of the motivation step is very context dependent. • But it always has to be clear in your mind. • Sometimes you may discover that the assessment is not relevant to the decision, and you can stop right there. 2.08 E • Assessing Ranges & Probabilities
5. Verify 4. Assess 2. Structure • Define assessment. • Choose known scale. • Draw out assumptions. 3. Condition 2. Structure 1. Motivate The second step structures the assessment in an unambiguous way. • Define clearly what you are looking for. • Understand why you are using a specific source to provide the information required. 2.08 E • Assessing Ranges & Probabilities
To check if the assessment is clearly defined, apply the “clairvoyant’s test.” 2. Structure Clairvoyant’s Test: A clairvoyant can answer any unambiguous question about how the future will unfold. If we could ask, could the clairvoyant answer the question? I can’t tell you. Market share in terms of patients or revenue? In which indication, line and combination regimen? In which country? I don’t have an answer. Launch before or during the lifecycle of our product? One or more competitor products? For what indication? In the US or WW? What will be Tarceva’s market share in 2012? What is the probability of a competitor’s entry? 2.08 E • Assessing Ranges & Probabilities
A clearly defined assessment question will pass the “clairvoyance test.” 2. Structure • What will be the full year 2012 patient share of Tarceva monotherapy in second line advanced non small cell lung cancer in the United States as reported by IMS Health? • What is the probability of a competitor entry with a refractory NHL indication in the US market before the launch of our product in 2016? 2.08 E • Assessing Ranges & Probabilities
Document the definition and units. 2. Structure Documentation Example for Development Costs of a Drug 2.08 E • Assessing Ranges & Probabilities
5. Verify 3. Condition • Compensate for availability. • Assess extremes first. 4. Assess 3. Condition 2. Structure 1. Motivate Step 3 tests the extremes – to compensate for biases. • Think robustly about the factors that drive the uncertainty of the assessment. • e.g. If order of entry is a key driver, make sure the analog selected reflects it. • Think of plausible scenarios that would drive the High or the Low. 2.08 E • Assessing Ranges & Probabilities
Reasons for extremely low Asking reasons for extremes compensates availability bias and provides a rationale for low and high scenarios. 3. Condition Reasons for extremely high When asking an expert, keep these in front of her to help overcome anchoring. 2.08 E • Assessing Ranges & Probabilities
Develop the actual • assessment. • Avoid anchors. 4. Assess 5. Verify 4. Assess 3. Condition 2. Structure 1. Motivate In Step 4 quantifies the assessment. • Think of this step as the “time to put a stake on the ground”. • Dealing with the future, you will rarely have complete information to make an assessment. • Ranges are there to incorporate uncertainty. 2.08 E • Assessing Ranges & Probabilities
The ‘low’ estimate: there is only 10% chance that market share will be as low or lower. The ‘high’ estimate: there is only a 10% chance that market share will be higher. ‘Low’ (3%) ‘Base’ (8%) ‘High’ (17%) When making a quantitative assessment, we estimate three points to represent the range of uncertainty. 4. Assess The “base” estimate is the 50-50 point. 0 5 10 15 20 25 30 Market Share(sales-weighted %) 2.08 E • Assessing Ranges & Probabilities
Q: What is a “surprisingly” low estimate of share—so low, there is only 10% chance of that share or lower? A: 3% Q: What is a surprisingly high estimate of share, with only a 10% chance of that share or higher? A: 8% Q: What is your 50/50 estimate of share—equally likely to be higher or lower? A: 17% Low Base High .8 Probability of Being “In the Range” 0 .5 1.0 .9 .1 .2 .3 .4 .6 .7 .8 The questions to ask are similar to those used to assess ranges for sensitivity analysis. 4. Assess Sample Questions for Assessing a Range on Market Share 2.08 E • Assessing Ranges & Probabilities
A familiar reference can help judge the appropriate level of “surprise” of the assessment. 4. Assess • If we flipped a coin three times, it would be a surprise if all three flips were heads. (That event has 12.5% probability.) • If a stranger tried to guess your birth month, she would have roughly 8% chance of guessing correctly. • If we were to guess the height of the next American man to walk into the room, a surprisingly high estimate would be 6 feet 2 inches. (Only about 8% are at least that tall.) 2.08 E • Assessing Ranges & Probabilities
Value Question Q: What is a surprisingly low cost—one that is so low that there is only a 10 percent chance costs will be the same or lower? A: $11 million Points may be assessed by asking for either the probability or the value. 4. Assess Initially, use value questions to assess the 10th, 50th and 90th percentiles. Sample Assessment Questions Probability Question Q: What is the probability that cost will be less than orequal to $11 million? A: 10 percent 2.08 E • Assessing Ranges & Probabilities
High 17% 25% So we represent the range of uncertainty with low, base, and high estimates (i.e., the “10-50-90” numbers) with probabilities 25%, 50%, and 25%. Base 8% 50% The ‘low’ estimate is a good representative value of the bottom 25% of the probability range. Low 3% 25% The ‘high’ estimate is a good representative value of the top 25% of the probability range. ‘Base’ (8%) ‘High’ (17%) ‘Low’ (3%) The low, base, and high estimates are good representatives of the bottom and top “quartiles.” 4. Assess The ‘base’ estimate represents the middle 50% of the probability range. 0 5 10 15 20 25 30 Market Share(sales-weighted %) 2.08 E • Assessing Ranges & Probabilities
Probability Question Q: What is the probability that we will fail to pass this clinical trial? A: 10 percent For a discrete event, first assess the probability for the least-likely event. 4. Assess For more than two outcomes, assess probabilities from unlikely to likely events. Outcome of Clinical Trial Failure Probability = p Success Probability = 1 – p 2.08 E • Assessing Ranges & Probabilities
Document each assessment for easy reference during model and data refinements. 4. Assess Documentation Example for Development Costs of a Drug 2.08 E • Assessing Ranges & Probabilities
5. Verify • Ask “check” questions. • Show results. • Ask if “willing to bet.” 5. Verify 4. Assess 3. Condition 2. Structure 1. Motivate Step 5 verifies the consequences or results of the assessment. 5. Verify • This step responds the question “Does the assessment make sense”? 2.08 E • Assessing Ranges & Probabilities
One way to verify results is to ask “check” questions. 5. Verify • Would you rather bet on: • Whether the actual value will be below the 10th percentile or above the 90th percentile • Whether the actual value will be between the 10th and 50th percentiles or between the 50th and 90th percentiles • Whether the actual value will be above or below the 50th percentile. • If the response is not indifferent to each of these bets, revise the assessment. 2.08 E • Assessing Ranges & Probabilities
Another way to verify results is to do some back-of-the-envelope math. 5. Verify • Applying the assessment to a simple calculation should generate results that are consistent with the product and market assumptions • If you chose an analog curve for market share, multiply by price and see if the revenues obtained are reasonable. • When assessing Technical Risk by phase, calculate the compound risk. • Calculate the annual cost to the patient for your drug, given your price per day assessment. • Compute what your market share growth estimate means in terms of number of converted patients. It is not possible to do it with every assessment (leave that to the model), but putting a few of your main assumptions in context will help you verify their soundness. 2.08 E • Assessing Ranges & Probabilities
5 4 3 2 1 Here is a “quick start” summary of the five-step assessment procedure: • Motivation – Why is this assessment necessary? 2. Structure – Clearly define the assessment. Document it. 3. Conditioning - Test the extremes. Understand the drivers of uncertainty. 4. Develop the Assessment – Put a stake in the ground 5. Verify – Does the assessment make sense? Test it. 2.08 E • Assessing Ranges & Probabilities
5. Verify 4. Assess 3. Condition 2. Structure 1. Motivate We have discussed quantifying uncertainty with ranges and probabilities. Got it! ... 30% ... • Using Probabilities to Communicate • Avoiding Biases • Developing Assessments Key to improving assessments is feeding back “what actually happens” to those who make assessments 2.08 E • Assessing Ranges & Probabilities