Download
1 / 27
270 likes | 414 Vues
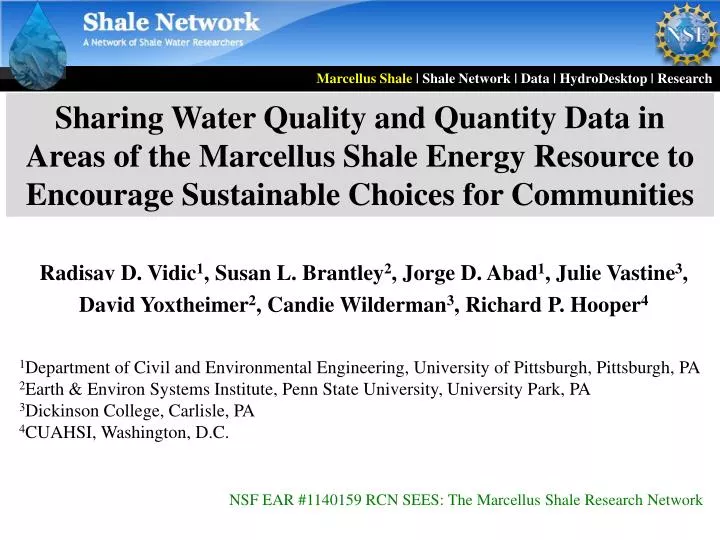
Marcellus Shale | Shale Network | Data | HydroDesktop | Research . Sharing Water Quality and Quantity Data in Areas of the Marcellus Shale Energy Resource to Encourage Sustainable Choices for Communities.

E N D
Marcellus Shale | Shale Network | Data | HydroDesktop | Research Sharing Water Quality and Quantity Data in Areas of the Marcellus Shale Energy Resource to Encourage Sustainable Choices for Communities Radisav D. Vidic1, Susan L. Brantley2, Jorge D. Abad1, Julie Vastine3, David Yoxtheimer2, Candie Wilderman3, Richard P. Hooper4 1Department of Civil and Environmental Engineering, University of Pittsburgh, Pittsburgh, PA 2Earth & Environ Systems Institute, Penn State University, University Park, PA3Dickinson College, Carlisle, PA 4CUAHSI, Washington, D.C. NSF EAR #1140159 RCN SEES: The Marcellus Shale Research Network
Marcellus Shale | Shale Network | Data | HydroDesktop | Research http://www.pioga.org/publication_files/marcellus-shale-home-grown-energy.pdf ~ 5000 feet ~ 100 feet Pay zone http://fracfocus.org/ Arthur et al., 2008
Marcellus Shale | Shale Network | Data | HydroDesktop | Research Human and Environmental Concerns • Water Withdrawal • Runoff and Groundwater Impacts • Fracwater Transport • Impoundments • Inadequate Fracwater Treatment • Injection • Seismic Risks • Solids Disposal • Cement and Casing Failure • Methane Migration • Radioactivity • Degradation of Water Supplies • Eminent Domain (right of passage) • Invasive Species • Fragmentation of Forests • Others we may not know!? • …
Marcellus Shale | Shale Network | Data | HydroDesktop | Research What is the EPA worried about? • Water Volume: Will large withdrawals of water impact drinking water resources? • Fracking fluids: If hydraulic fracturing fluids are spilled, how will this impact drinking water resources? • Hydrofracturing itself: What are the possible impacts of the injection and fracturing process on drinking water resources? • Flowback and Produced Waters: If flowback and produced waters are spilled, how will this impact drinking water resources? • Wastewater Treatment and Disposal: What are the possible impacts of inadequately treated hydraulic fracturing wastewaters on drinking water resources?
Marcellus Shale’s Spills | Methodology | Tenmile Creek | Scenarios | Discussions | Conclusions Unconventional Drilling Violations: Surface Spills 301CSL - Stream discharge of IW including drill cuttings, oil, brine and/or silt 301UNPMTIW - Industrial waste was discharged without permit. 307CSL - Discharge of industrial waste to waters of Commonwealth without a permit. 401CLS - Discharge of pollutional material to waters of Commonwealth. 402611 - Failure to meet effluent limits of permit Produced from data reported in PADEP - Oil and Gas Compliance Report (1/1/2005 to 3/22/2013) http://www.depreportingservices.state.pa.us/ReportServer/Pages/ReportViewer.aspx?/Oil_Gas/OG_Compliance
Marcellus Shale | Shale Network | Data | HydroDesktop | Research The problem: according to Center for Rural Pennsylvania, ~300 watershed groups in PA are collecting data …but the data is not being organized together Gaging Stations Flow measurements ph Temperature Dissolved Oxygen
Marcellus Shale | Shale Network | Data | HydroDesktop | Research The ShaleNetworkwill create a central and accessible repository for geochemistry and hydrology data collected by watershed groups, government agencies, industry stakeholders, and universities working together todocument natural variability and potential environmental impacts of shale gas extraction activities. Our Hypothesis A database of water quality and quantity will provide the understanding needed to make good decisions.
Marcellus Shale | Shale Network | Data | HydroDesktop | Research • Goal 1 - Identify groups collecting water data in region of shale-gas extraction • Goal 2 - Create a sustainable networking among the groups by hosting an annual meeting • Goal 3 - Work with CUAHSI to create a database that can establish background and can document impacts • Goal 4 – Train graduate students in database development and use for communities • Goal 5 - Facilitate community groups in collecting, organizing, and interpreting their data • Goal 6 - Evaluate hydrogeochemical data using GIS in relation to population and economic data
Marcellus Shale | Shale Network | Data | HydroDesktop | Research Who provides the data? Citizen scientists, Universities, Colleges, Government Agencies, Industry, Non-profits What types of data are we collecting? Surface water, ground water, injection water, flowback water, production water, wastewater effluent
Marcellus Shale | Shale Network | Data | HydroDesktop | Research What types of measurements are we including in the database? • Water quantity: discharge rates or stage height, etc • Sensor data (water quantity, water quality) • Analyses of collected samples: ISCO or grab samples • Samples can be sporadic or systematically collected
Marcellus Shale | Shale Network | Data | HydroDesktop | Research Find Raw Data Put it into a specific spreadsheat file format Register the data so that it can be harvested by Hydrodesktop (the online tool that enables people to find the data) Upload the data to a Hydroserver (the computer that hosts the data so anyone can get to it online)
We are building the ShaleNetwork database as a HydroServer in the CUAHSI Hydrological Information System (NSF facility). CUAHSI’s tool, HydroDesktop, allows people to find the data along with data such as USGS NWIS and EPA STORET. Below: all locations for which Shale Network has uploaded data since 10/11 By putting Shale Network data (shalenetwork.org) into the CUAHSI Hydrologic Information System (cuahsi.org), it can be easily accessed with all the other data that are available, using HydroDesktop.
Screen shot of HydroDesktop showing Shale Network data from one of our citizen scientists groups • ShaleNetwork database now includes data for water quality in stream waters, spring waters, ground waters, injection, flowback, and production waters in the area of Devonian shale gas development in northeast. • The database is accessed through HydroDesktop(download from www.cuahsi.org), and www.shalenetwork.org • We have uploaded data from published literature, unpublished literature, industry, government agencies, volunteer groups, university scientists Screen shot from HydroDesktop using ShaleNetwork data: Data provided by K. Kasserman, Youghiogheny Riverkeeper
There are a lot of data (shown here, all Shale Network sites as of Nov 2012 (black) …but… The density of sampling is low compared to well density (green) in Pennsylvania.
What are the impacts of shale gas industry in Marcellus Shale region? Drilling and fracking operations Flowback/produced water impacts Gas migration
Mud Release also due to drilling accidents: e.g. Larry’s Creek Larry’s Creek is near Salladsburg, PA, located in Mifflin Twp., Lycoming Co., PA. Off route 287, north of Jersey Shore, above the junction of Routes 220 and 287 The week of 10/19/2011, drilling was occurring beneath Larry’s Creek. The creek was running rich with clay but the settling process was working very well. Then drilling “fracked out” and released drilling mud to creek. SRBC saw an increase in conductivity/turbidity in the creek
Data from Susquehanna River Basin Commission (SRBC): ShaleNetwork database data shown here in a screen shot on HydroDesktop SRBC's automated Remote Water Quality Monitoring Network (RWQMN) Increase of the turbidity as a result of the spill Day of the Spill
Interpreting the sensor data is difficult due to problems of fouling..sensors also do not reveal the cumulative impact SRBC's automated Remote Water Quality Monitoring Network (RWQMN) Increase of the turbidity as a result of the spill Day of the Spill
Discharges of Marcellus flowback were legal in PA before 2011; spills also occurred 2008…high TDS in Monongahela River with high Br, Cl, sulfate…contamination from water treatment plant receiving Marcellus flowback and coal mine water Fish kill in Dunkard Creek, a tributary of Monongahela River in 2009 A number of spills of fracture fluid, brine, and flowback water in Susquehanna county Br in Allegheny River
In early 2011, several noticed that Br in intake for PWSA was high enough to be problematic…at that time it was legal to send flowback waters to municipal water treatment plants for river discharge
Br in Allegheny River water at Pittsburgh Water and Sewer Authority intake Screen shot from Shale Network data in HydroDesktop
Bromide in surface water versus time for all available data in Shale Network database for 40 PA counties with Marcellus drilling High concentrations since 2003 were generally in areas with permitted brine discharge or for Salt Springs. Line = 3 above mean from 1960-2003 for USGS data (early data not shown). Detection limit = 10 – 200 ug/L. Includes data from EPA Storet, USGS NWIS, SRBC, Appal. Geo. Consulting, ALLARM, PA DEP Vidicet al., Science, 2103
I can’t show lots of other examples of WQ problems today from the database. Why? ?? There are many problems but… ?? There are nota lot of problems… No matter how hard we look in natural waters, we will not see many WQ issues documented because contaminant output is small compared to water fluxes • We haven’t had enough time to look for them (we and others need to look harder) • Spills and other incidents are relatively small and local -- sensor/sampling density is too low to pick up the incidents (we need more sensors/sample takers) • Sensors or sample-taking is occurring in the wrong places (we need better siting of sensors and samples) • Sensors or sample-taking is not aimed at the right analytes (we need more analyses) • The important effects are cumulative and incremental and difficult to see (we need to look over longer time periods) • Data are generally not being released (we just need to advocate for release of data from government, industry, private homeowners) • Water quality in PA is already impacted in many places: seeing new impact is difficult given the “old” impact (we need to assess background, especially in the presence of acid mine drainage or agricultural impact) • We do not have analytical tools for many organic contaminants (we need to develop analytical methods) • Organic compounds that are in use have changed over time or change in the environment (we need a strategy to monitor for organics) • Maybe contaminants have been released in the solid phase – cuttings, sediments – that will release contamination over time or under different conditions (we need to look for longer periods of time)
Concentrations of methane in groundwater samples (all data accessible from Shale Network database) Vidic et al., Science, 2013 Data from USGS and Maryland Dept of Natural Resources Data from: Breen et al., 2007; Kappell and Nystrom, 2012; White and Mathes, 2006; Moore and Buckwalter, 1996; Pham and Bolton, 2012
Methane concentrations in 449 ground water wells in NY, PA, and W.Va (1) Kappell, W. M. and Nystrom, E. A., 2012. Dissolved methane in New York groundwater. U.S. Geological Survey Open-File Report 2012-1162. (2) White, J. S. and Mathes, M. V., 2006. Dissolved-gas concentrations in ground water in West Virginia: U.S. Geological Survey Data Series 156. 8. (3) Osborn, S. G., Vengosh, A., Warner, N. R., and Jackson, R. B., 2011. Methane contamination of drinking water accompanying gas-well drilling and hydraulic fracturing. Proceedings of the National Academy of Sciences . (4) Breen, K. J., Revesz, K., Baldassare, F. J., and McAuley, S. D., 2007. Natural gases in ground water near Tioga Junction, Tioga County, North-central Pennsylvania -- Occurrence and use of isotopes to determine origins, 2005. Scientific Investigations Report Series 2007-5085, 65. (5) Osborn, S. G. and McIntosh, J. C., 2010. Chemical and isotopic tracers of the contributions of microbial gas in Devonian organic-rich shales and reservoir sandstones, northern Appalachian Basin. Applied Geochemistry25, 456-471. Nonactive area is > 1 km from active gas drilling; active is < 1 km from drilling
Marcellus Shale | Shale Network | Data | HydroDesktop | Research 2013 Shale Network Workshop attendees Please join us for 2014 Shale Network Workshop May 11-12, 2014 www.shalenetwork.org