Download
1 / 23
230 likes | 349 Vues
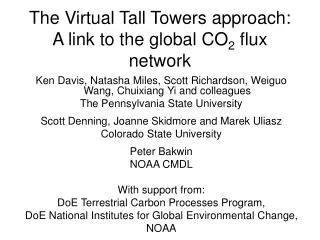
The Role of Virtual Tall Towers in the Carbon Dioxide Observation Network. Martha Butler The Pennsylvania State University ChEAS Meeting June 5-6, 2006. Virtual Tall Towers. What is a virtual tall tower (VTT)?

E N D
The Role of Virtual Tall Towersin the Carbon Dioxide Observation Network Martha Butler The Pennsylvania State University ChEAS Meeting June 5-6, 2006
Virtual Tall Towers • What is a virtual tall tower (VTT)? • At a continental site with continuous CO2 mixing ratio measurements in the surface layer, estimate the mixing ratio in the mixed layer above during mid-day hours • Where/when does a VTT make sense? • Existing site (typically a flux tower) where there is a hole in the existing observation network • Resources to invest in upgrading sampling and calibration procedures • How is this done? • Testing the correction method • What a VTT is not!
The Richardson-Miles Package For more information, see www.amerifluxco2.psu.edu
Performance Testing Difference of daily averages Difference between the PSU system and WLEF 76m CO2 measurements in a test from April-August 2004. [Miles/Richardson/Uliasz, in prep.]
If You Prefer Numbers… Monthly Summary for 1998
What Is This Adjustment? Following the mixed layer similarity theory of Wyngaard & Brost [1984] and Moeng & Wyngaard [1989], the vertical gradient of a scalar in the boundary layer: where gb and gt are bottom-up and top-down gradient functions scaled by boundary layer depth zi w* is the convective velocity scale wc0 and wczi are the surface and entrainment fluxes of the scalar C
The Gradient Functions The LES gradient functions are from a study by Patton et al. [2003]. The observed gradient functions will appear in Wang et al. [in review in BLM].
Implementation at a Flux Tower • We tested the concept at WLEF, adjusting 30m CO2 mixing ratios to a VTT height of 396m and comparing with the observations at 396m. • Required input: displacement height, tower height, VTT height and time series of tower top CO2 mixing ratio, CO2 flux, sensible heat flux, and temperature. • We estimate the mixing ratio at the VTT height for 3-6 midday hours, depending on time of year. • We use the boundary layer depth algorithm from Yi et al. [2001]. • We screen for minimum sensible heat flux (20 W m-2) and boundary layer depth (700m).
The Algorithm As Used Here, - ΔC is the adjustment to the 30m CO2 mixing ratio - z0 is the measurement height, 30m - zVTT is the virtual tall tower height, 396m - α is a fraction applied to the surface flux to represent the entrainment flux - d is the displacement height - gb and gt are empirical fits for the gradient functions of Wang et al.
What a VTT is not…. • Unlike a tall tower: • Limited number of species observed • Midday observations only • More gaps in the observations • Nocturnal boundary layer not represented • Added uncertainty and bias • What if it isn’t a flux tower and/or permanent site? • Sample as high on a tower as possible • Infer the local flux for the micromet adjustment • By model • By sampling at multiple heights on tower
Will VTTs Be Useful? • Adding a few more continental observation sites • Density of measurements • Spatial flux variability • Synoptic variability • Availability of VTT data • Tradeoffs…. • Is the bias and uncertainty a problem? • Can these data help constrain regional budgets?
Model Performance at 396m vs. 30m The red lines are time series of hourly samples at WLEF in September 2002 at 396m and 30m from a tracer transport model using analyzed winds and standard “background” fluxes for fossil fuel, air-sea flux and a balanced terrestrial flux. The black lines are the CO2 time series observations at WLEF. Data are normalized to the beginning of the year 2002.
VTT References • Davis, K. J., 2003, Well-calibrated CO2 mixing ratio measurements at flux towers: The virtual tall towers approach, 12th WMO/IAEA Meeting of Experts, Toronto. • Davis, K. J. et al., in prep, Methodology for a flux-tower based CO2 observing network: Virtual tall towers. • Moeng, C.-H. and J. C. Wyngaard, 1984, Statistics of conservative scalars in the convective boundary layer, JAS, 41(21), 3161-3169. • Moeng, C.-H., and J. C. Wyngaard, 1989, Evaluation of turbulent transport and dissipation closure in second-order modeling, JAS, 45, 2311-2330. • Patton, E. G., et al., 2003, The influence of forest canopy on top-down and bottom-up diffusion in the planetary boundary layer, QJRMS, 129A, 1415-1434. • Wang, W. et al., in review, Observations of the top-down and bottom-up gradient functions in the convective boundary layer from a very tall tower, BLM. • Wyngaard, J. C., 1987, A physical mechanism for the asymmetry in top-down and bottom-up diffusion, JAS, 44(7), 1083-1087. • Wyngaard, J. C. and R. A. Brost, 1984, Top-down and bottom-up diffusion in the convective boundary layer, JAS, 41, 102-112. • Yi, C. et al., 2001, Long-term observations of the dynamics of the continental boundary layer, JAS, 58(10), 1288-1299.