Download
1 / 24
250 likes | 439 Vues
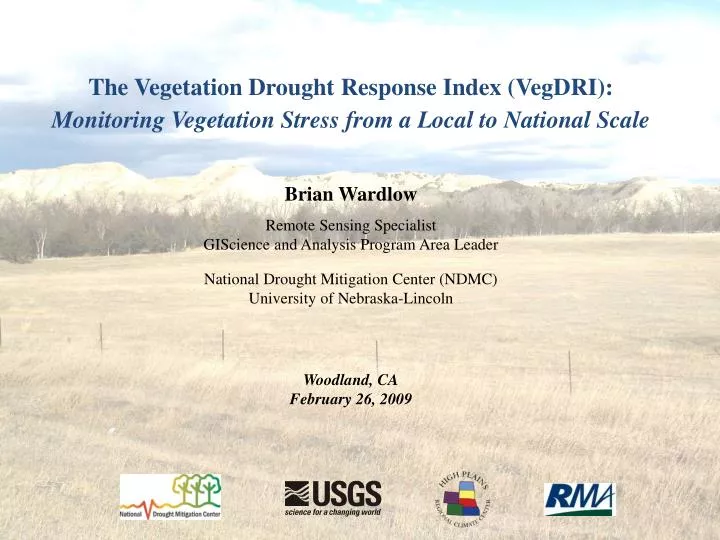
The Vegetation Drought Response Index (VegDRI): Monitoring Vegetation Stress from a Local to National Scale Brian Wardlow Remote Sensing Specialist GIScience and Analysis Program Area Leader National Drought Mitigation Center (NDMC) University of Nebraska-Lincoln Woodland, CA

E N D
The Vegetation Drought Response Index (VegDRI): Monitoring Vegetation Stress from a Local to National Scale Brian Wardlow Remote Sensing Specialist GIScience and Analysis Program Area Leader National Drought Mitigation Center (NDMC) University of Nebraska-Lincoln Woodland, CA February 26, 2009
What is VegDRI? VegDRI is a new ‘hybrid’ drought index that integrates: - satellite-based observations of vegetation conditions - climate-based drought index data - biophysical characteristics of the environment to produce 1-km spatial resolution maps that depict ‘drought-related vegetation stress’and are regularly updated (currently at 2-week interval) during the growing season.
VegDRI vs. U.S. Drought Monitor VegDRI California– September 8, 2008 U.S. Drought Monitor California – September 9, 2008 Goal of VegDRI Tool:National-level monitoring capabilities with local-scale information (i.e., county to sub-county level) regarding the level of drought stress on vegetation.
VegDRI - An Integrated Approach Climate Component Remote Sensing Component Biophysical Component + +
VegDRI - An Integrated Approach Climate Component Remote Sensing Component Biophysical Component + + • Role: Satellite-based observations provide information on the • spatial distribution and general condition of vegetation. • (+) Spatially detailed information about vegetation across large • geographic areas. • (-) Difficult to discriminate drought impacted areas from locations • under other types of environment stress (flooding, fire, hail, & • pests) or experiencing land use change.
VegDRI - An Integrated Approach Climate Component Remote Sensing Component Biophysical Component + + • Role: Climate-based drought index maps provide a ‘broad-scale’ measure • of dryness that can be used for interpretation of the vegetation stress • recorded in the satellite observations. • - Drought areas typified by below average vegetation conditions • recorded in the satellite data and drier than normal conditions in the climate data.
VegDRI - An Integrated Approach Climate Component Remote Sensing Component Biophysical Component + + Role: Different characteristics of the environment are considered that influence climate-vegetation interactions. - land use/land cover type - irrigation - soil available water capacity - elevation - ecological setting
Regression Tree Model (*) VegDRI Methodology 1. Historical Database Development Satellite Data Data Input Variables 2. Model Development 3. Map Generation 1) Percent Annual Seasonal Greenness (PASG) 2) Start of Season Anomaly (SOSA) Climate Data 1) Palmer Drought Severity Index (PDSI) 2) Standardized Precip. Index (SPI) Biophysical Data 1-km VegDRI Map • 1) land use/ cover type • soil available water • capacity (STATSGO) • ecoregion type • irrigation status • elevation (*) Models developed from a 20-year historical record (1989 – 2008) of bi-weekly climate and satellite observations at 2,200+ weather station locations. Biophysical variables are static over time.
VegDRI June 16, 2008 Eastern States Expansion (Spring 2009) VegDRI Expansion Schedule • Information currently • available for California: • - 2007 & 2008 • growing seasons • Production of a 20-year • historical record of • VegDRI maps. • (1989 – 2008) • Year-round production • & weekly map updates • planned in 2009. • (*) Bi-weekly maps currently available.
VegDRI Website and Products VegDRI products are available at the VegDRI page within the Monitoring section of the NDMC website. http://www.drought.unl.edu/vegdri/VegDRI_Main.htm
1. VegDRI Quick-View Maps(multiple spatial scales) Regional-level State-level Sub-state level
1. VegDRI Quick-View Maps (cont.)(land cover type) Complete view Cropland view Rangeland view
2. VegDRI Area Statistics (% area)(currently available at state-level only) • Summarize the % area of each VegDRI class for ‘current’ map and • all prior dates in the growing season. • Specific tables available for rangeland and cropland.
3. Change Maps VegDRI Difference_Map (20 Oct - 06 Oct, 2008) • 3 Types: • Prior period • ex. - Sep 4, 2007 vs. Sep 10, 2007 • 2)Same period from the prior year • or a specific year in past • (* currently not available) • ex. – Sep 24, 2007 vs. Sep 24, 2006 • Historical average(* currently not available) • ex. – Sep 24, 2007 vs. average for Sep 24 (1989 • through 2006) Type of Change Detreriorated No Change Improved Out of season
4. Animations Goal: Visualize spatial and temporal changes in drought patterns across a specific year or multiple years for a state or sub-state region.
5. Trendlines (in development) Plots the average VegDRI values over the growing season for a specific geographic area (e.g., county) and land cover type (e.g., cropland and rangeland). Comparisons of VegDRI could be made between specific years and/or the long-term average condition.
6. Dynamic Map Viewer (in development) • Zoom in & pan across VegDRI maps • Overlay multiple layers of other • information • - county boundaries, rivers, roads, and • other boundaries (resource districts, • section lines) • - historical climate maps • - land cover maps • - U.S. Drought Monitor maps
6. Dynamic Map Viewer (in development) Zoom in to Texas Overlay county boundaries View a VegDRI map for a specific date(s). The user customizes the view of the map for their specific needs and interests.
6. Dynamic Map Viewer (in development) Capability to visualize information at the local level for a county or multiple counties.
VegDRI Standardized Precipitation Index (SPI) 6. Dynamic Map Viewer (in development) View VegDRI maps in combination with other types of maps. Examples: - climate-based drought indices (SPI and PDSI - U.S. Drought Monitor - land use & land cover type
Possible Uses of VegDRI Information • by Agricultural Producers: • Justify sub-county declarations for the release of CRP • lands for emergency grazing for parts of counties that • might be severely impacted by drought.
Possible Uses of VegDRI Information • by Agricultural Producers: • Justify sub-county declarations for the release of CRP • lands for emergency grazing for parts of counties that • might be severely impacted by drought. • Gauge rangeland and haying conditions in other states to • determine locations to move cattle for grazing and • purchase hay and other feed
Possible Uses of VegDRI Information • by Agricultural Producers: • Justify sub-county declarations for the release of CRP • lands for emergency grazing for parts of counties that • might be severely impacted by drought. • Gauge rangeland and haying conditions in other states to • determine locations to move cattle for grazing and • purchase hay and other feed. • Guide to assist new ranchers better manage their grazing • lands and become better land stewards during drought • events.