Download
1 / 9
110 likes | 501 Vues
Section 12.4 – Weather Analysis and Prediction. 8 th Grade Earth and Space Science Class Notes. Wednesday, 5/ 8. Warm – Up Explain what happens at a cold front. How is a cold front represented on a weather map? Write down the HW.

E N D
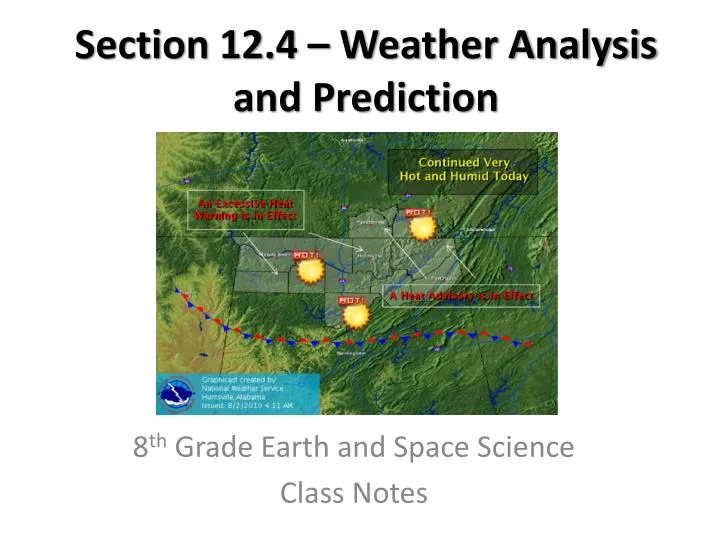
Section 12.4 – Weather Analysis and Prediction 8th Grade Earth and Space Science Class Notes
Wednesday, 5/8 Warm – Up • Explain what happens at a cold front. How is a cold front represented on a weather map? • Write down the HW. Learning Goal – Identify the various ways that weather data is collected. Agenda • Warm-Up Question/Review HW • Class notes/discussion of Section 12.3 • Work on Weather Data WS (pg. 38) and 12.3 Review (pg.42) Homework - Air Mass WS and Section 12.1 Review due by Friday, 5/10 Global Wind Systems WS and Section 12.2 Review due by Friday, 5/10 Weather Data WS (pg. 38) and Section 12.3 Review due by Friday, 5/10
Station Models • A record of weather data for a particular site at a particular time • Uses meteorological symbols (see Figure 12.17) for example • All meteorologists to have a convenient and efficient way to share data
Plotting Station Model Data • Meteorologists use lines to connect points of equal or constant values. • Isobars – lines of equal pressure • Isotherms – lines of equal temperature
Interpreting Station Model Data • Isobars that are close together indicate strong winds • Isobars that are far apart indicate light winds • Indicates high and low pressure systems
Digital Forecasts • Created by applying physical principles and math to atmospheric variables and making a prediction about how these variables will change over time • Main method used by present day meteorologists
Analog Forecasts • Based on comparison of current weather patterns to those of the past • Useful for conducting monthly or seasonal forecasts
Short-Term Forecasts • One to three days based on behavior of larger surface and upper-level features (low pressure, high pressure, etc.) • Usually accurate for temperatures and precipitation
Long-Term Forecast • Less reliable than short-term forecasts • 4-7 day forecasts rely on circulation patterns in the troposphere and upper stratosphere • Forecasts for months or seasons are based on weather cycles or patterns