Download
1 / 25
250 likes | 409 Vues
Verification of the dynamical downscaling of ERA40 by ALADIN. Nedjeljka Žagar 1 , M. Žagar 2 , J. Cedilnik 2 , G. Gregorič 2 and J. Rakovec 1. 1 Chair of Meteorology, University of Ljubljana 2 Meteorological office, Environmental Agency of Slovenia. Motivation.

E N D
Verification of the dynamical downscaling of ERA40 by ALADIN Nedjeljka Žagar1, M. Žagar2, J. Cedilnik2, G. Gregorič2 and J. Rakovec1 1Chair of Meteorology, University of Ljubljana 2Meteorological office, Environmental Agency of Slovenia
Motivation Modelling the wind climatology for Slovenia at scales around 10 km This is an intermediate step towards a higher-resolution climatology for the wind energy estimates This talk: optimal modelling setup for the dynamical downscaling of ERA40 comparison with observations during MAP-SOP (autumn 1999) and with the ECMWF reanalyses of the MAP-SOP period (Keil&Cardinali, QJRMS, 2004) 27th EWGLAM meeting 4 October 2005
Methodology Dynamical downscaling of ERA40 (10-year period) Mesoscale model: a 10-km ALADIN model 10-km ALADIN 120-km ERA40 27th EWGLAM meeting 4 October 2005
Direct vs. two-step nesting ERA40 30-km ALADIN 10-km ALADIN ERA40 10-km ALADIN 27th EWGLAM meeting 4 October 2005
Increasing spatial variability An example: building-up of the kinetic energy spectrum during the first hours of the forecast Model level 20, time +12 Model level 20, time 0 Model level 10, time +12 100 km Model level 10, time 0 27th EWGLAM meeting 4 October 2005
Average spectra shape Average kinetic energy Average vorticity Average divergence Lowest model level 100 km Average over 70 days of MAP-SOP and for model levels 8-18 (4-9 km) 27th EWGLAM meeting 4 October 2005
Below 10 km Dynamical downscaling of ERA40 Mesoscale model: a 10-km ALADIN model Pure dynamical downscaling (Žagar&Rakovec, 1999) to 2.5 km 2.5-km ALADIN 10-km ALADIN 27th EWGLAM meeting 4 October 2005
Methodology Define the optimal model setup by comparison against observations, and comparison against MAP-SOP reanalyses 10-km ALADIN 40-km MAP-SOP reanalyses 27th EWGLAM meeting 4 October 2005
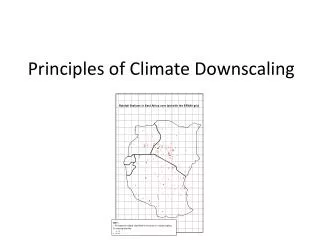
Observations exposed mountaintops 3-4 m/s valleys, basins and lowlands Adriatic coast 2-3 m/s 1-2 m/s 27th EWGLAM meeting 4 October 2005
Observations LI windrose exposed mountaintops 3-4 m/s valleys, basins and lowlands Adriatic coast 2-3 m/s 1-2 m/s 27th EWGLAM meeting 4 October 2005
Diurnal periods (26-22 hrs) Longer than diurnal periods (<26 hrs) Subdiurnal periods (6-22 hrs) Observed temporal variability Frequency (cycles/day) 96 48 12 8 6 24 Period (hours) Based on the time serie of the zonal wind during MAP-SOP, data every three hours, totally 560 data points 27th EWGLAM meeting 4 October 2005
Diurnal periods (26-22 hrs) Longer than diurnal periods (<26 hrs) Subdiurnal periods (6-22 hrs) Observed temporal variability Frequency (cycles/day) LTD D SD 86 12 2% exposed mountaintop station RO 27th EWGLAM meeting 4 October 2005
Diurnal periods (26-22 hrs) Longer than diurnal periods (<26 hrs) Subdiurnal periods (6-22 hrs) Observed temporal variability Frequency (cycles/day) LTD D SD 86 12 2% exposed mountaintop station RO 38 26 36% coastal station PO 27th EWGLAM meeting 4 October 2005
Observed temporal variability Diurnal periods (26-22 hrs) Longer than diurnal periods (<26 hrs) Subdiurnal periods (6-22 hrs) Frequency (cycles/day) LTD D SD 86 2 12% exposed mountaintop station RO 38 26 36% coastal station PO valley station SG 52 7 41% 27th EWGLAM meeting 4 October 2005
Specific questions How well are these spectra reproduced by an operational LAM? Can we relate modelled spectra with traditional verification scores (mae, rmse)? How dependent are model-produced spectra on the nesting method and the horizontal domain size? How much better is the wind field from the 10-km ALADIN than from the ECMWF model (40-km MAP-SOP reanalyses) ? 27th EWGLAM meeting 4 October 2005
MAP-SOP reanalyses Observations ALADIN-10 ALADIN-2.5 ERA40 reanalyses Modelled spectra Exposed mountaintop station RO 27th EWGLAM meeting 4 October 2005
MAP-SOP reanalyses Observations ALADIN-10 ALADIN-2.5 ERA40 reanalyses Modelled spectra Coastal station PO 27th EWGLAM meeting 4 October 2005
MAP-SOP reanalyses Observations ALADIN-10 ALADIN-2.5 ERA40 reanalyses Modelled spectra Valley station SG 27th EWGLAM meeting 4 October 2005
Subdiurnal power range mountain stations coastal station valley stations 27th EWGLAM meeting 4 October 2005
Longer than diurnal power range mountain stations valley stations coastal station 27th EWGLAM meeting 4 October 2005
Traditional score comparison 3 ALADIN domains Mean absolute error for various ALADIN-10 horizontal domains 24-h persistence subdiurnal range 27th EWGLAM meeting 4 October 2005
Subdiurnal varibility: a 12-h filter Mean absolute error Filtering improved scores for MAP-SOP 27th EWGLAM meeting 4 October 2005
Wind roses: impact of a 12-h filter OBS ALADIN MAP-SOP After filtering 27th EWGLAM meeting 4 October 2005
Conclusions • Downscaling of ERA40 by the ALADIN model - ok • Conventional verification scores: a 10-km ALADIN superior to the MAP-SOP reanalysis data – expected However, • More energy in the sub-diurnal (SD) range in the MAP-SOP data than in the ALADIN – less expected, peculiar • Spatial spectra slope does not follow – 5/3 law • Direct nesting (resolution jump 12010 km) produced best conventional scores – !? • Smoothing MAP-SOP dataset improves its conventional scores Consequences: • The mesoscale model wind field displays significant senstivity with respect to the horizontal domain definition – basin stations contain 30-50% of energy in the SD range 27th EWGLAM meeting 4 October 2005
Questions • In dynamical downscaling, spatial variability increase is much more important than the increase of the temporal variabiliy? • What shift from low frequency to high-frequency variability can/should be expected? • -5/3 slope: how strong constraint should it be? 27th EWGLAM meeting 4 October 2005