Download
1 / 67
670 likes | 825 Vues
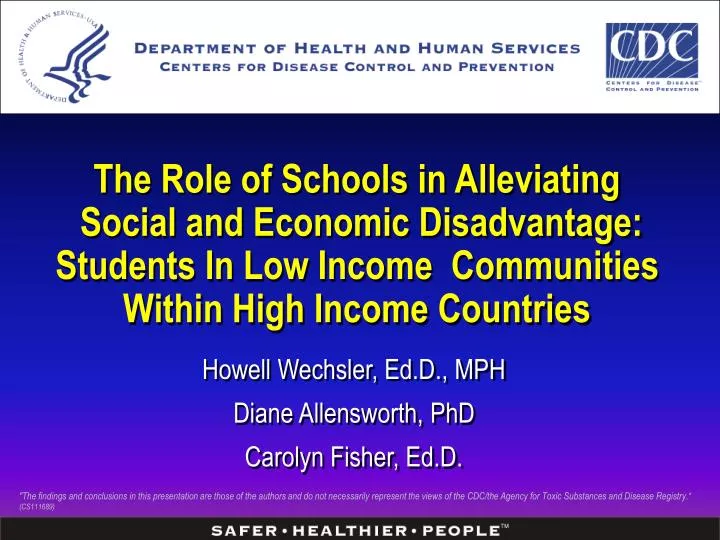
The Role of Schools in Alleviating Social and Economic Disadvantage: Students In Low Income Communities Within High Income Countries. Howell Wechsler, Ed.D., MPH Diane Allensworth, PhD Carolyn Fisher, Ed.D.

E N D
The Role of Schools in Alleviating Social and Economic Disadvantage:Students In Low Income CommunitiesWithin High Income Countries Howell Wechsler, Ed.D., MPH Diane Allensworth, PhD Carolyn Fisher, Ed.D. "The findings and conclusions in this presentation are those of the authors and do not necessarily represent the views of the CDC/the Agency for Toxic Substances and Disease Registry.“ (CS111689)
Overview • Background: Health and education disparities in the U.S. • 7 school health strategies for alleviating social and economic disadvantage
Two Overarching Goals Increase quality and years of healthy life Eliminate health disparities
Health disparities are the differences in the incidence, prevalence, mortality, and burden of diseases and other adverse health conditions that exist among specific population groups in the United States Poor / low socio-economic (SES) populations Minority populations African American Hispanic Native American Asian
Percentage of U.S. Children Under 18 Living in Poverty by Racial/Ethnic Group, 2004 Source: U.S. Bureau of the Census. Income, Poverty, and Health Insurance Coverage in the U.S.: 2004. Report P60, no. 229, Table B-2.
Compared with All U.S. Children, Poor Childrenin U.S. Are More Likely to: Have poor health and chronic health conditions1 Be born premature and at a low birth weight.2-3 Suffer from mental health conditions, such as personality disorders and depression.2-3 Have behavioral problems such as increased aggression and emotional problems.4-5 Engage in risky health-related behaviors, such as smoking and early initiation of sexual activity.2-3 1- Bradley RH & Corwyn RF. Ann Rev Psych 2002;53:371-99. 2- Haveman R et al. Childhood Poverty and Adolescent Schooling and Fertility Outcomes. In Duncan GJ and Brooks-Gunn J (eds) Consequences of Growing Up Poor: Russell Sage, 1997. 3- Brooks-Gunn J and Duncan GJ. The Effects of Poverty on Children. Future of Children, Child and Poverty, 1997;7(2). 4- Huffman LC et al. Risk Factors for Academic and Behavioral Problems at the Beginning of School. The Child and Mental Health Foundation Agencies Network, 2000. 5- Child Trends, 2002. Children in Poverty: Trends, Consequences, and Policy Options.
Percentage of Children in U.S. Facing Social Hardships by Poverty Status Mother HS dropout -------------------------- Single parent --------------------------------------- Teen parent ------------------------- Poor neighborhood ------------------- 3 or more siblings -------------------- Few children books --------------------------- in house 0 10 20 30 40 50 ------ Poor Children _____ Non-poor children Duncan GJ and Magnuson KA. Can Family Socioeconomic Resources Account for Racial and Ethnic Test Score Gaps. Future of Children. 2005; 15 (1), 35-54.
Fair or Poor Health, by Race/Ethnicity and Income, 2001 Percent with fair or poor health White (Non-Latino) Latino African American (Non-Latino) White (Non-Latino) Latino African American (Non-Latino) < 100% of Poverty 200% + of Poverty Data: National Center for Health Statistics, National Health Interview Survey. Source: Health, United States, 2003, Table 57.
Compared with White Non-Hispanic Youth in U.S., Black Non-Hispanic and Hispanic Youth Have: • Higher all-cause death rates • Higher death rates from homicide • Higher rates of teen pregnancy and STDs • Higher prevalence of overweight and type 2 diabetes • Higher prevalence of untreated dental caries
Percentage of Children in U.S. Facing Social Hardships by Racial / Ethnic Group White % Black % Hispanic % Mother HS dropout 7 18 15 Single parent 15 50 24 Teen parent 10 22 19 Low quality neighborhood 5 23 21 3 or more siblings 11 21 18 Few children books 2 20 29 Source: Duncan GJ and Magnuson KA. Can Family Socioeconomic Resources Account for Racial and Ethnic Test Score Gaps. Future of Children. 2005; 15 (1), 35-54.
Percentage of High School Students Who Had Sexual Risk Behaviors, by Race / Ethnicity,* 2005 Had First Sexual Intercourse Before Age 13 Years Had Sexual Intercourse with >4 Persons During Their Life * B > H > W Source: National Youth Risk Behavior Survey, 2005
Percentage of High School Students Who Actually Attempted Suicide,* by Sex and Race/Ethnicity,** 2005 Females Males * One or more times during the 12 months preceding the survey; ** Females: H > W, B; Males: H > W Source: CDC, National Youth Risk Behavior Survey, 2005
Disparities in Health Care Access Among U.S. Adolescents by Racial /Ethnic Group *Even though reported mild-severe emotional/behavioral problems Source: Fox et al. Racial and Ethnic Disparities in Adolescent Health and access to care. Fact Sheet for the Advancement of Adolescent Health, In Center Strategies. No. 1, January 2007.
Societal Factors: Poverty Educational inequalities Environmental Factors: Poor physical and social environment Community norms unsupportive of protective behaviors Individual/Behavioral Factors: Individual lifestyle Language barriers Medical Care Factors: Lack of access to preventative care and quality care Lack of cultural competence of providers Causes of Health Disparities
Percentage of U.S. Population Age 25 and Above Who Reported Being in Excellent or Very Good Health, by Educational Attainment and Family Income, 2001 Family Income Note: Includes those who responded “excellent” or “very good” on a scale of “excellent,” “very good,” “good,” “fair,” and “poor.” Source: US, DHHS, CDC, Control, National Center for Health Statistics, National Health Interview Survey, 2001, previously unpublished tabulation (Oct. 2003).
Dropping out of school before high school graduation is associated with: substance abuse delinquency intentional and unintentional injury unintended pregnancy poor long-term health Healthy People 2010 Objective 7-1: Increase High School Completion
Performance on National Reading Test, 4th Grade, by Family Income, 2003 Source: USDOE, NCES, National Assessment of Educational Progress (NAEP)
Performance on National Reading Test, 4th Grade, by Race, Ethnicity, 2003 Source: USDOE, NCES, National Assessment of Educational Progress (NAEP)
Educational Attainment Among Native Born U.S. Young Adults, Ages 24-26 Source: Original analysis by Child Trends of 2001 Current Population Survey Data. Wald M and Martinez T. Connected by 25: Improving the Life Chances of the Country’s Most Vulnerable 14-24 Year Olds. Stanford University; William and Flora Hewlett Foundation Working Paper. November, 2003.
Causes of the Education Achievement Gap • Poverty • Poor health • Lack of early-childhood instruction • Attending high poverty schools • Inequitable education resources • Lack of credentialed/experienced teachers • Curricular deficiencies
Positive Effects of Participation in Early Childhood Development Programs Such as Head Start • Less likely to be retained in grade and placed in special education • Higher scores on standardized achievement tests • Improved high school graduation rates • Decreased teen pregnancy • Decreased delinquency • Higher rates of employment and home ownership Source: The effectiveness of early child development programs: A systematic review. Am J Prev Med, Vol. 24, No.3S
In 2005, 47% of 3- to 5-year-olds living below the poverty threshold participated in center-based, early childhood care and education programs, compared with 60% of 3- to 5-year olds living above the poverty threshold. In 2001, only 28% of children living in neighborhoods with high concentrations of child poverty participated in a Head Start Program. Participation in Early Childhood Education in the U.S. Source: www.childtrendsdatabank.org/indicators
U.S. $ 868 Illinois: $2,026 New York: $2,040 Pennsylvania: $ 882 Virginia: $1,105 Funding Gaps Between High- and Low-Poverty Districts Per Student in U.S. and Sample U.S. States, 2001-2002 Source: The Funding Gap 2004, available at www.edtrust.org
Percentage of Inexperienced* Teachers in Schools with High and Low Enrollment of Poor and Minority Students in U.S. *Teachers with 3 or fewer years of experience. “High” and “low” refer to top and bottom quartiles. Source: National Center for Education Statistics, “Monitoring Quality: An Indicators Report,” December 2000.
Percentage of Out-of-Field* Teachers in Schools with High and Low Enrollment of Poor and Minority Students in U.S. *Teachers lacking a college major or minor in the field. Data for secondary-level core academic classes. Source: Richard M. Ingersoll, University of Pennsylvania. Original analysis for the Ed Trust of 1999-2000 Schools and Staffing Survey.
STRATEGY 1:Support Efforts to Reduce the Educational Achievement Gap
North Carolina – 4th Grade Math Black-White Gap Narrows by 18 Points Source: North Carolina Department of Public Instruction, http://www.dpi.state.nc.us/
National 4th Grade Reading Test Scores Among All Students in U.S., and Low-income Black Students in U.S. and Delaware Source: USDOE, NCES, National Assessment of Educational Progress (NAEP)
High-quality early childhood education Rigorous, challenging curricula for all Equitable distribution of funding and teacher talent What Can Make the Difference?
Percentage of U.S. High School Students Getting Mostly A’s or Mostly B’s and Mostly D’s or F’s*Who Engage in Selected Health Risk Behaviors *As reported by students Source: Unpublished analyses of CDC, National Youth Risk Behavior Survey, 2003
The 8 Components of a Coordinated School Health Program Health Education Physical Education Family and Community Involvement Health Services Health Promotion for Staff Nutrition Services Healthy and Safe School Environment Counseling, Psychological, and Social Services
Physical Education (Project Spark, Sallis et al. 1999) Higher reading scores on the Metropolitan Achievement Test Program did not interfere with academic achievement Nutrition Services (School Breakfast Program, Meyers et al.1989, Murphy et al.1998) Improved academic achievement outcomes Increased math grades Decreased absences and tardy rates School Health Interventions and Academic Achievement
School Health Interventions and Academic AchievementAddressing multiple CSHP components Family Community Involvement, Health Education, and Healthy School Environment (Seattle Social Development Project, O’Donnell et al. 1995, Hawkins et al. 1999) Improved achievement test scores and grades for boys, not for girls Follow-up study showed better school achievement by grade 12 and greater commitment and attachment to school Health Education and Family and Community Involvement (Asthma Self-management Program, Evans et al. 1987) Improved academic grades
Society of State Directors of Health, Physical Education and Recreation (SSDHPER) Association of State and Territorial Health Officials (ASTHO) Making the Connection: Health and Student Achievementwww.thesociety.org © 2002 Association of State and Territorial Health Officials (ASTHO) and the Society of State Directors of Health, Physical Education and Recreation (SSDHPER)
STRATEGY 3:Promote Collaboration Across the Health andEducation Sectors
CDC Funds State Education Agencies to Partner with State Health Departments in Helping Schools Implement CSHP and Prevent Chronic Disease Risks
National Association of Chronic Disease Directors Directors of Health Promotion and Education Society of State Directors of Health, Physical Education, and Recreation Professional Development for State Agencies by State Agency Health and Education Professionals with a Focus on Collaboration To advance the understanding and implementation of CSHPs within schools
How Schools Work and How to Work with Schools • How education works at the school, district, state, and national levels • Practical tips for how to work with educators, administrators, and policymakers www.nasbe.org Coming SoonHow Health Departments Work and How to Work with Health Departments by the National Association of Chronic Disease Directors
The 8 Components of a Coordinated School Health Program Health Education Physical Education Family and Community Involvement Health Services Health Promotion for Staff Nutrition Services Healthy and Safe School Environment Counseling, Psychological, and Social Services
Working with school staff, families, students, and community partners to identify local priorities and implement local solutions for health improvement A rigorous approach that builds on accurate data and sound science A systematic approach to planning that aims to eliminate gaps and redundancies A focus on professional development for staff and institutionalizing sustainable changes in systems A Coordinated School Health ProgramEmphasizes…
Racial and Ethnic Approaches to Community Health (REACH) Health Priority Areas and Populations Priority Areas: Infant Mortality Breast and Cervical Cancer Screening and Management Cardiovascular Diseases Diabetes HIV/AIDS Immunizations Populations: African American Alaska Native American Indian Asian American Hispanic American Pacific Islander
Empowering community members to seek better health Bridging gaps between the health care system and community Changing social and physical environments to overcome barriers to good health Implementing strategies that fit unique social, political, economic, and cultural circumstances Moving beyond individuals to community and systems change What Are REACH Communities Doing?
Health Outcomes in REACH Communities:American Indians with High Blood PressureCurrently on Medication * Data from REACH 2010 communities that focus on Cardiovascular Disease/Diabetes. BRFSS = Behavioral Risk Factor Surveillance System
Health Outcomes in REACH Communities: Smoking Prevalence Among Asian Men, 2002-2006* * Data from REACH 2010 communities that focus on Cardiovascular Disease/Diabetes
Build a culture of collaboration with a collective outlook Give communities knowledge and tools needed to create change Assess and focus on the underlying causes of poor health Motivate communities to mobilize and organize existing resources Enlist organizations whose primary mission is not related to health Make changes to organizations, community environments, and policies that will help to ensure that health improvements are long-lasting and programs are self-sustaining REACH U.S.: Some of the Keys to Success for Addressing Racial and Ethnic Health Disparities http://www.cdc.gov/nccdphp/publications/aag/reach.htm
STRATEGY 5:Address Root Causes …Such as School Connectedness