Download
1 / 24
240 likes | 451 Vues
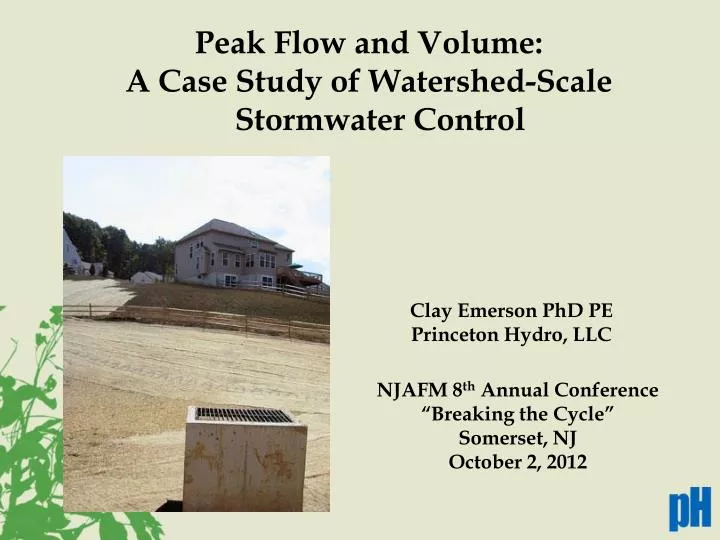
Peak Flow and Volume: A Case Study of Watershed-Scale Stormwater Control. Clay Emerson PhD PE Princeton Hydro, LLC. NJAFM 8 th Annual Conference “Breaking the Cycle” Somerset, NJ October 2, 2012. OUTLINE. Objective Methods Results Conclusions. OBJECTIVE.

E N D
Peak Flow and Volume: • A Case Study of Watershed-Scale Stormwater Control Clay Emerson PhD PE Princeton Hydro, LLC NJAFM 8th Annual Conference “Breaking the Cycle” Somerset, NJ October 2, 2012
OUTLINE • Objective • Methods • Results • Conclusions
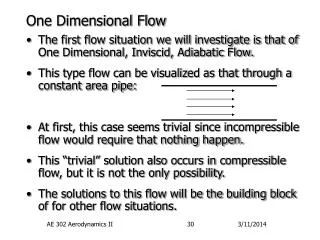
OBJECTIVE • Post development peak flow rate not to exceed predevelopment level • Initiated the Release Rate method of SWM in PA • No runoff volume requirements • Designed for 2-100yr storms
OBJECTIVE Over 100 detention basins ~17% Impervious Case Study: Valley Creek Chester County PA
METHODS Precipitation Data • Network of five to seven recording gages • Five minute interval • GageInterp precipitation grids in HEC-DSS format
METHODS Detention Basin Information Survey of Detention Basins • 111 Basins Surveyed • Storage vs. Outflow Curves • Photographic Record • GPS Location Record
SURVEY Maintenance
METHODS Only 4% of the total area drains to a detention basin. However, this accounts for 25% of the directly connected impervious area.
RESULTS • 0.5” Rainfall • Peak Without – 45cfs • Peak With – 46cfs • 2.0” Rainfall • Peak Without – 117cfs • Peak With – 114cfs
RESULTS Rest of watershed Detention basin areas with (red) and without (blue)
RESULTS • Just detention basin drainage areas. (2”)
RESULTS • Hypothetical Volume Control • Volume control of 0.5”, 1.0”, 2.0” of runoff from the basins’ drainage areas.
RESULTS PA IDF Curve Largest storm was only ~2.0” on average.
2 year storm RESULTS 50 Years Daily Rainfall Record Chadds Ford Rain Gage • 2+ year design • Accounts for only 3% of annual precipitation
RESULTS • 1- through 100-year design storms • uniform distribution
CONCLUSIONS Detention basins in Valley Creek watershed: • have a negligible impact on stormwater flow • are designed for only 3% of the annual rainfall • are often poorly maintained
CONCLUSIONS Focus on hydrology: • Act 167 “release rate” districts? • Recreate predevelopment run-off volume • If run-off volumes are maintained watershed wide peak flow rates will follow • Streambank erosion, baseflow, flow duration relationship
RESULTS “Runoff quantity impacts”
QUESTIONS Clay Emerson PhD PE cemerson@princetonhydro.com Princeton Hydro, LLC Emerson, C.H., Welty, C., Traver, R.G., “A Watershed-Scale Evaluation of a System of Stormwater Detention Basins” ASCE Journal of Hydrologic Engineering, Vol. 10, No. 3, pgs. 237-242 May/June 2005.