Download
1 / 15
150 likes | 236 Vues
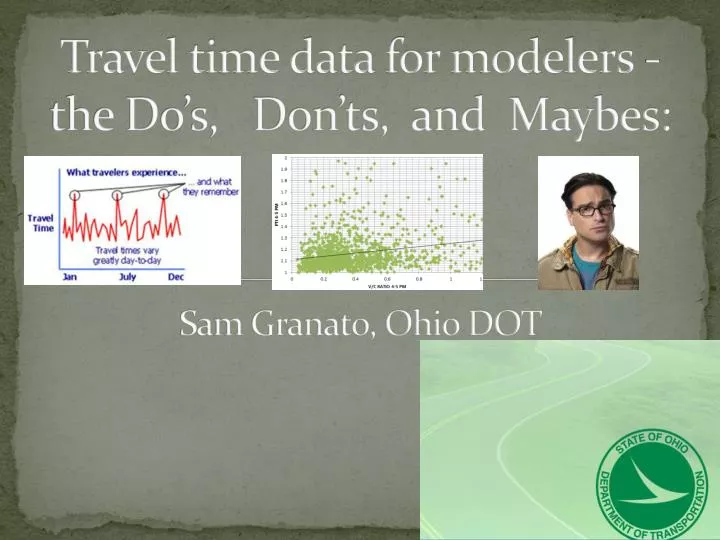
Travel time data for modelers - the Do’s, Don’ts, and Maybes: Sam Granato, Ohio DOT. Why do we need data like this?. Because our customers don’t care about volume to “capacity” ratios, instead they want to know:. In the beginning – floating car surveys and spot speed sensors.

E N D
Travel time data for modelers - the Do’s, Don’ts, and Maybes:Sam Granato, Ohio DOT
Why do we need data like this? • Because our customers don’t care about volume to “capacity” ratios, instead they want to know:
In the beginning – floating car surveys and spot speed sensors • CMS / CMAQ project effectiveness • Used for MPO travel model validation since 1990’s to better model congestion & Level of Service • Statewide, developed for “speed table” by type of road – both average and running speeds (to start up some “junction-based” model networks in Ohio)
Then, the same but more (and more things to use them for) • “high sample size” floating car (arterials in Parkersburg/Marietta and freeways in Cleveland) • Can use to measure variability in travel time as well as more confident average, and how the variability changes as function of distance/# segments (i.e. from link-level to travel-path level
New Sources of Speed Data • “Archive” data from vehicle fleets & cell probes • Extensive road network coverage, could replace or reduce/redeploy need for “floating car” surveys
GPS Data availability : • About 33,000 directional miles of TMC roadway statewide (including five miles into adjacent states)
Quality checks for any “biases”: First, compare to ATR sites (mostly rural freeways): • Differences exists in how these are measured (spot vs space mean speeds) • Statewide, average speeds higher on the ATR’s (about 7%) • Check for vehicle class based on WIM station locations on I-70 (Licking county) and I-77 (Noble county).
Quality checks for any “biases”: Second, compare to statewide floating car surveys • Differences exist in route segmentation • Very small sample sizes in the floating car surveys • Overall, in close agreement statewide on average speeds including by time of day
GPS data (vs floating car)– uses & limitations • Far higher sample sizes, more versatility on hour of day / day of week / season of year • Good for overall speed validation of model on average values, not necessarily for variability/reliability • Depending on level of access, might not have ability to see the impact of distance on reliability / journey time • “Buffer index” measures found to measure system-level, not user-level reliability
Local sample speed data provided us both (expected) sample sizes by corridor/HOD AND percentile values
Sample finding #1: V/C ratio does not predict congestion (and LOS) very well
Sample finding #1-A: Speed does not vary that much by time of day • Volume offset by driver and vehicle characteristics • Signal timing, parking management
Sample finding #2: Curves and Railroad crossings don’t seem to slow us down that much
Questions? • Sam.granato@dot.state.oh.us • 614-644-6796