Download

1 / 11
110 likes | 301 Vues
Penny Stacking. By Ricky Benner and Stefanie Richman. Procedure for Penny Stacking. Subjects had to stack as many pennies in piles of 10 as they could in 60 seconds, but they could only stack them on the table one at a time

E N D
Penny Stacking By Ricky Benner and Stefanie Richman
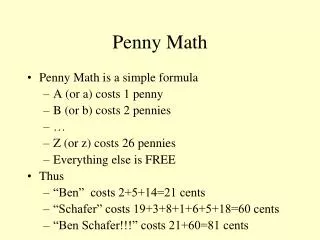
Procedure for Penny Stacking • Subjects had to stack as many pennies in piles of 10 as they could in 60 seconds, but they could only stack them on the table one at a time • Though subjects were not supposed to stack pennies in their hand and before placing them on the table, lack of consistent clarity in rules caused the collection of an outlier • Subjects could pick pennies out of the cup, or place them in their hand or on the table
Marginal Distributions • Eyewear • Contacts: 9/27=33.3333% • Glasses: 1/27=3.7037% • Nothing: 17/27=62.9630% • First Block Class • Elective: 2/27=7.4074% • English: 8/27=29.6296% • Gym: 4/27=14.8148% • Late Arrival: 5/27=18.5185% • Math: 1/27=3.7037% • Science: 5/27=18.5185% • Social Studies: 2/27=7.4074%
Conditional Distributions: Eyewear • Contacts • Elective: 1/9=11.1111% • English: 2/9=22.2222% • Gym: 2/9=22.2222% • Late Arrival: 1/9=11.1111% • Math: 1/9=11.1111% • Science: 0/9=0% • Social Studies: 2/9=22.2222% • Glasses • Elective: 0/1=0% • English: 0/1=0% • Gym: 0/1=0% • Late Arrival: 0/1=0% • Math: 0/1=0% • Science: 1/1=100% • Social Studies: 0/1=0% • Nothing • Elective: 1/17=5.8824% • English: 6/17=35.2941% • Gym: 2/17=11.7647% • Late Arrival: 4/17=23.5294% • Math: 0/17=0% • Science: 4/17=23.5294% • Social Studies: 0/17=0%
Conditional Distributions: First Block Class • Elective • Contacts: ½=50% • Glasses: 0/2=0% • Nothing: ½=50% • English • Contacts: 2/8=25% • Glasses: 0/8=0% • Nothing: 6/8=75% • Gym • Contacts: 2/4=50% • Glasses: 0/4=0% • Nothing: 2/4=50% • Late Arrival • Contacts: 1/5=20% • Glasses: 0/5=0% • Nothing: 4/5=80% • Math • Contacts: 1/1=100% • Glasses: 0/1=0% • Nothing: 0/1=0% • Science • Contacts: 0/5=0% • Glasses: 1/5=20% • Nothing: 4/5=80% • Social Studies • Contacts: 2/2= 100% • Glasses: 0/2= 0% • Nothing: 0/2= 0%
Association between Eye Wear and First Block Class • There is an association between eyewear and first block class because the marginal distribution of eyewear does not equal the conditional distribution of first block class • Same with the marginal distribution of first block class and the conditional distribution of eyewear
Conclusion • Distribution • Slightly right skewed • Median and IQR should be used in data’s description • Outlier present • Close to a normal model • Ricky’s data collection is very different from Stef’s due to differing procedural measures • Association • Eyewear and first block class are not independent of one another