Download
1 / 30
300 likes | 429 Vues
2012 Citizen Survey Results. What our citizens want and how they think we’re doing. Who took the survey?. Questions 1 through 4 and 27-32 provided demographics for survey participants. The majority of respondents : were homeowners who voted in the most recent election (74%);

E N D
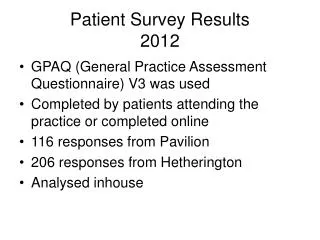
2012 Citizen Survey Results What our citizens want and how they think we’re doing.
Who took the survey? Questions 1 through 4 and 27-32 provided demographics for survey participants. The majority of respondents : were homeowners who voted in the most recent election (74%); lived in Huntsville for 20 years or more(46.5%); felt the City had improved in the last five years(43%); and were somewhat involved in the community (34%).
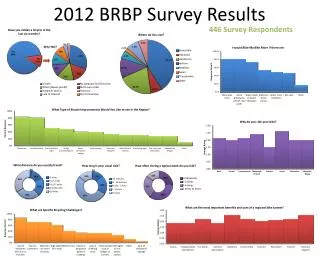
How many took the survey? 301 physical surveys + 353 online surveys = 654 total utilized surveys (+ 8 submitted after acceptance period) = 662 total received
How are we doing? In general, 60% of the population is satisfiedwith life in the City, about 15%are very satisfied and about 17% are dissatisfied.
How are we doing? Providing a safe community Providing services in an efficient manner Keeping citizens informed about city business Maintaining a qualified workforce of employees Planning for future needs of residents
How are we doing? Having employees that respond to citizen needs Providing an adequate forum for public input Working with county organizations including Walker County, Huntsville ISD or Sam Houston State University The overall appearance of your City/neighborhood
How are we doing with customer service? Within the last year, 68 % of respondents have had contact with a City employee. Considering nine areas of customer service, respondents were very satisfied with three categories, satisfied with four categories, and had no opinion about two categories.
How are we doing with customer service? Citizens were most satisfied with: • The courtesy of the person answering the telephone • Directed to the correct department • Employee(s) I worked with represented the City well
How are we doing with essential services? According to results, the City is doing an excellent job with: • Fire services • Solid waste • Police • Library
How are we doing with essential services? As well, respondents indicated the City is doing a good job with: Street maintenance Recycling Sidewalks Water service Sewer service Animal control Restaurant inspection Park facilities Code enforcement Main Street events Recreation programs Arts and cultural services Drainage
Question #33: What do you think is the most important issue facing Huntsville?
Question #33: What do you think is the most important issue facing Huntsville? #1 Most Used Phrase: Growth (Occurs 86 times, 18% of respondents) Questions 6 and 21 asked how satisfied/dissatisfied citizens were with the work the City of Huntsville and the City Council had done planning for the future needs of residents. For the City of Huntsville, the majority – 245– were satisfied, while 169 were dissatisfied. With respect to City Council, the majority – 188 – were satisfied, while 156 were dissatisfied. #2 Most Used Phrase: Huntsville
Question #33: What do you think is the most important issue facing Huntsville? #3 Most Used Phrase: Tax 13. For the following list of City services, indicate which you would be most willing to pay increased rates to improve or expand. The top five services chosen included: Police (207) Fire Services (199) Street Maintenance (148) Sidewalks (141) Water Service (137) Note: 476 respondents selected at least one category, while 178 (27.2% of respondents) skipped the question altogether.
Question #33: What do you think is the most important issue facing Huntsville? #4 Most Used Phrase: Water Q7: A majority of residents (37%) consider “Adequate water supply” a current, major concern. Q 13: Approximately 29% of residents would pay increased rates for improved/expanded water service.
Question #33: What do you think is the most important issue facing Huntsville? #4 Most Used Phrase: Water Citizens also displayed a willingness to conserve water as necessary. Approximately 85% of residents were aware of the Stage 2 restrictions in place last year. As well, about 92% of respondents reduced landscape watering, and 84% reduced other outdoor watering.
Question #33: What do you think is the most important issue facing Huntsville? #5 and #6 Most Used Phrases: Jobs and Economic Development Approximately 8% of open-ended responses addressed the need for better, higher-paying jobs. Specifically, in Q 22, approximately 50% of respondents wanted more light industry/warehouses and professional services. Also, 65-75% also wanted more retail stores, full-menu restaurants, major supermarkets, and family-oriented entertainment.
Question #33: What do you think is the most important issue facing Huntsville? #7 Most Used Phrase: Traffic
Question #33: What do you think is the most important issue facing Huntsville? #7 Most Used Phrase: Traffic 160 responses mention 11th Street//30 responses mention Highway 30 – Total of 190 79 responses mention Sam Houston Avenue 77 responses mention lights/ light length/light timing 28 responses mention speed/speeding 19 responses mention downtown area 8 responses mention State Highway 19 4 responses each for Interstate 45, pedestrians 3 responses for State Highway 75
Streets Department In Q7, respondents indicated the condition of streets and sidewalks were both major concerns. Traffic flow into neighborhoods was regarded as a minor concern.
Streets Department In Q 8, respondents were asked to consider eight roadway issues. They assigned the following ratings: Very Important Important • Resurfacing roads • Placement/maintenance of street lighting • Clearing brush and tree limbs in right-of-way • Improved street signage • Filling in potholes • Flooding and drainage control • Reducing traffic congestion • Timing of traffic signals
Police and Fire Departments In Q 14, 12 items out of a list of 14 first-response categories were given a “good” rating. Those items included: • Efforts to prevent crime • Visibility of police in neighborhoods • Overall quality of police protection • Enforcement of traffic laws • Quality of animal control • Visibility of police in retail areas
Police and Fire Departments In Q 14, 12 items out of a list of 14 first-response categories were given a “good” rating. Those items included: • How quickly police respond to emergencies • Quality of local ambulance service • Police officer professionalism • Firefighter professionalism • Overall quality of fire protection • Fire personnel emergency response
Police and Fire Departments IMPORTANT NOTE: Some items in the survey received a greater majority of “no response” than any other rating. “Police safety education programs” and “fire safety education programs” were two such categories. Without the “no response” percentage, these categories also received “good” ratings.
Police and Fire Departments Regarding general safety, in Q 15, respondents said they felt “safe” in each of the following areas: In your neighborhood At the City park closest to your home When shopping in Huntsville At a Huntsville ISD school function In or around Sam Houston State University In the City in general
Entertainment In Q 16, respondents gave the following recreation activities/opportunities a “good” rating: • Athletic fields • Sports facilities • Aquatic center • Playgrounds
Entertainment The other answer choices in Q 16 received a majority of “no response.” • Dog parks • Lighted basketball courts • Jogging/biking trail • Natural habitat/interpretive areas • Community center/meeting space • Park restrooms (All received good ratings in past surveys)
Entertainment In Q 19, respondents indicated they would most likely utilize the following three features of the expanded Huntsville Public Library: • Adult Reading Areas • Genealogy Room • Computer Room Library rating as a whole increased from 21% “Excellent” in 2010 to 52.4% “Excellent” in 2012
Entertainment In Q 20, respondents indicated they visited the downtown area primarily for: • Shopping • Dining • Special events
Staying Informed In Q 23, the majority of respondents said they used the following to stay current on City news: City Web site – www.huntsvilletx.gov Local newspapers Radio City Connection newsletters Word of mouth
City Web site – www.huntsvilletx.gov In Q 24, the majority of respondents found it “easy” to navigate the City’s Web site. In Q 25 and 26, the majority of respondents had no opinion about the City’s efforts to provide financial transparency or the City’s live streaming/replaying of meetings. The majority of those who had an opinion – 34% in each category – were satisfied.