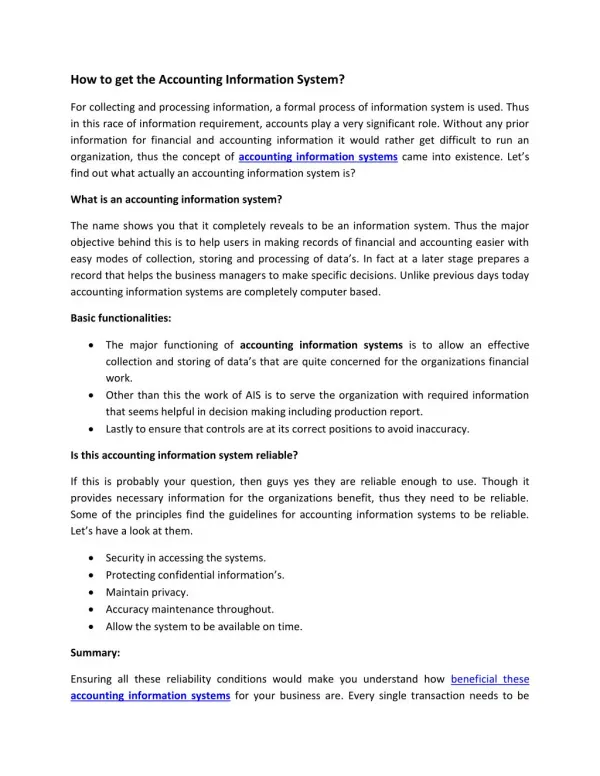
Download
1 / 14
150 likes | 306 Vues
DOCUMENTING ACCOUNTING SYSTEMS. The Activity Diagram Symbols. Solid circle. Start of the process in an activity diagram. Rounded rectangle. Event, activity, or trigger. Continues line. Sequence from one event or activity to the next. Dotted line. Flow of information between events.

E N D
The Activity Diagram Symbols Solid circle. Start of the process in an activity diagram Rounded rectangle. Event, activity, or trigger Continues line. Sequence from one event or activity to the next Dotted line. Flow of information between events Document. Represents a source document or report Diamond. A branch Table. A computer file from which data may be read from or recorded during business events Bull’s eye. End of Process
Preparing Overview Activity Diagrams Preparing the Activity Diagram Steps Preliminary Steps Step 3 Step 1 Step 4 Step 1 Step 5 Step 6
Step 1 Read the narrative and identify key Events. Before overview activity Diagram, must recognize events.
NAME Step 2 Annotate the narrative to clearly show event Boundaries and event names. • Use broad names that reflect the purpose of the event • Avoid names that focus on detailed steps in the event • Be specific • Start event names with a verb • Do Not include employee or departement names in event names
Step 3 Represent people or devices participating in the business process using swimlanes • Create a swilane for each person or departement responsible for various events in the narrative • Create a swimlane for entities outside the organization that initiate events in the process • Create a swimlane for the computer system • Write the name of the appropriate person or departement in the swimlane
Diagrams Diagram each event, and show the sequence of events in the business process Step 4 a. Draw a solid circle to represent the start of the process b. If the event is triggered by an agent outside the organization, show a rounded rectangle for the trigger. c. Set up a rounded rectangle for the event in the swimlane of the person or department within the organization who is responsible for the event d. It the event is triggered by an agent outside the organization, connect the trigger (see step b) to the event with a continuous line e. Otherwise, connect the previous to the current event with a continuous line Repeat steps b through e for each subsequent event f. Draw a bull’s eye to represent the end of the process
Error in documenting events and sequences of events • All the events identified in Step 1 and 2 are not shown on the activity diagram. • Additional events not identified in Step 1 and 2 are shown on the activity diagram • Continuous lines connecting events are not shown • Events are labeled with agent names • Event names are not consistent with the names identified in step 2.
Draw documents created and used in the business process Step 5 • Draw a document symbol below the event that creates or modifies a document • Draw dotted lines to connect events and documents as follows: • Draw a flow from an event to a document to show that a document is prepared or modified by the event • Draw a dotted line from a document to an event to show that information on a document is being reviewed or used by the event or activity • It a document appears multiple times during the process, add status information showing how the object changes during the business process • c. Note that we focus on events that use, create, or modify documents
Error in representing documents and document flows • Verbs are mistakenly used in naming documents • Documents are not connected to events.
Step 6 Draw tables (files) created and used in the business process • Show computer tables in the computer column • Draw a flow from a table to an event to represent the fact that information in a table is being reviewed or used by the event • Include status information to show how the object changes during the business process
Error in representing tables and flow of information to and from tables include the following • Tables are named with verbs • Table attributes are listed instead of table names • All flows between events and tables are not shown
Preparing Detailed Activity Diagrams Step 1 Step 2 Step 3 Step 4 Annotate the narrative to show activities Prepared a workflow table Identify necessary detailed diagrams For each detailed diagram, perform the following steps Step 4.a Step 4.b Step 4.c Step 4.d Step 4.e Step 4.f Step 4.g
Step 4 For each detailed diagram, perform the following substeps Set up swimlanes for the agents participating in the event or events represented in the detailed diagram Step 4.a Add a rounded rectangle for each activity in the event(s) being documented in that detailed diagram Step 4.b Step 4.c Use continuous lines to show the sequence of the activities Step 4.d Set up any docuemnts created or used by the activities in that diagram Step 4.e Use dotted lines to connect activities and documents Document any tables created, modified, or used by the activities in the diagram in the computer column Step 4.f Step 4.g Use dotted lines to connect activities and tables