Download
1 / 1
10 likes | 132 Vues
Comparison of Gene Expression in H9 and iPS Cells. References . Comparison of Gene Expression in H9 and iPS Cells Sophie Lehar Manchester Essex High School, Manchester, MA Teacher: Dr. Maria Lonnett Burgess, Manchester Essex High School

E N D
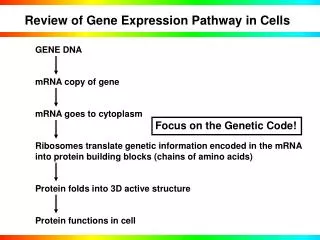
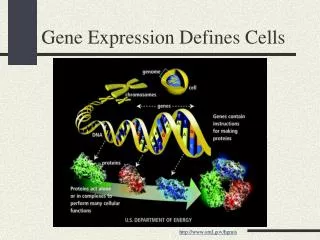
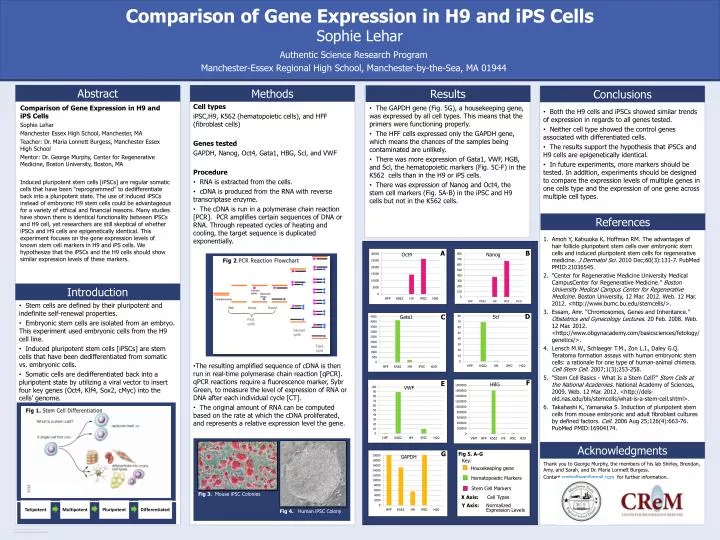
Comparison of Gene Expression in H9 and iPS Cells References Comparison of Gene Expression in H9 and iPS Cells Sophie Lehar Manchester Essex High School, Manchester, MA Teacher: Dr. Maria Lonnett Burgess, Manchester Essex High School Mentor: Dr. George Murphy, Center for Regenerative Medicine, Boston University, Boston, MA Induced pluripotent stem cells [iPSCs] are regular somatic cells that have been “reprogrammed” to dedifferentiate back into a pluripotent state. The use of induced iPSCs instead of embryonic H9 stem cells could be advantageous for a variety of ethical and financial reasons. Many studies have shown there is identical functionality between iPSCs and H9 cell, yet researchers are still skeptical of whether iPSCs and H9 cells are epigenetically identical. This experiment focuses on the gene expression levels of known stem cell markers in H9 and iPS cells. We hypothesize that the iPSCs and the H9 cells should show similar expression levels of these markers. Introduction Cell types iPSC,H9, K562 (hematopoietic cells), and HFF (fibroblast cells) Genes tested GAPDH, Nanog, Oct4, Gata1, HBG, Scl, and VWF Procedure RNA is extracted from the cells. cDNA is produced from the RNA with reverse transcriptase enzyme. The cDNA is run in a polymerase chain reaction [PCR]. PCR amplifies certain sequences of DNA or RNA. Through repeated cycles of heating and cooling, the target sequence is duplicated exponentially. The resulting amplified sequence of cDNA is then run in real-time polymerase chain reaction [qPCR]. qPCR reactions require a fluorescence marker, Sybr Green, to measure the level of expression of RNA or DNA after each individual cycle [CT]. The original amount of RNA can be computed based on the rate at which the cDNA proliferated, and represents a relative expression level the gene. Methods Authentic Science Research Program Manchester-Essex Regional High School, Manchester-by-the-Sea, MA 01944 Conclusions Both the H9 cells and iPSCs showed similar trends of expression in regards to all genes tested. Neither cell type showed the control genes associated with differentiated cells. The results support the hypothesis that iPSCs and H9 cells are epigenetically identical. In future experiments, more markers should be tested. In addition, experiments should be designed to compare the expression levels of multiple genes in one cells type and the expression of one gene across multiple cell types. Acknowledgments Thank you to George Murphy, the members of his lab Shirley, Brendan, Amy, and Sarah, and Dr. Maria Lonnett Burgess. Contact sophielhear@gmail.com for further information. Sophie Lehar Abstract Results The GAPDH gene (Fig. 5G), a housekeeping gene, was expressed by all cell types. This means that the primers were functioning properly. The HFF cells expressed only the GAPDH gene, which means the chances of the samples being contaminated are unlikely. There was more expression of Gata1, VWF, HGB, and Scl, the hematopoietic markers (Fig. 5C-F) in the K562 cells than in the H9 or iPS cells. There was expression of Nanog and Oct4, the stem cell markers (Fig. 5A-B) in the iPSC and H9 cells but not in the K562 cells. Amoh Y, Katsuoka K, Hoffman RM. The advantages of hair follicle pluripotent stem cells over embryonic stem cells and induced pluripotent stem cells for regenerative medicine. J Dermatol Sci. 2010 Dec;60(3):131-7. PubMed PMID:21036545. "Center for Regenerative Medicine University Medical CampusCenter for Regenerative Medicine." Boston University Medical Campus Center for Regenerative Medicine. Boston University, 12 Mar. 2012. Web. 12 Mar. 2012. <http://www.bumc.bu.edu/stemcells/>. Essam, Amr. "Chromosomes, Genes and Inheritance." Obstetrics and Gynecology Lectures. 20 Feb. 2008. Web. 12 Mar. 2012. <http://www.obgynacademy.com/basicsciences/fetology/genetics/>. Lensch M.W., Schlaeger T.M., Zon L.I., Daley G.Q. Teratoma formation assays with human embryonic stem cells: a rationale for one type of human-animal chimera. Cell Stem Cell. 2007;1(3);253-258. "Stem Cell Basics - What Is a Stem Cell?" Stem Cells at the National Academies. National Academy of Sciences, 2009. Web. 12 Mar. 2012. <http://dels-old.nas.edu/bls/stemcells/what-is-a-stem-cell.shtml>. Takahashi K, Yamanaka S. Induction of pluripotent stem cells from mouse embryonic and adult fibroblast cultures by defined factors. Cell. 2006 Aug 25;126(4):663-76. PubMed PMID:16904174. Stem cells are defined by their pluripotent and indefinite self-renewal properties. Embryonic stem cells are isolated from an embryo. This experiment used embryonic cells from the H9 cell line. Induced pluripotent stem cells [iPSCs] are stem cells that have been dedifferentiated from somatic vs. embryonic cells. Somatic cells are dedifferentiated back into a pluripotent state by utilizing a viral vector to insert four key genes (Oct4, Klf4, Sox2, cMyc) into the cells’ genome. Fig 2.PCR Reaction Flowchart A B D C F E Fig 1. Stem Cell Differentiation G Fig 5. A-G Key: Housekeeping gene Hematopoietic Markers Stem Cell Markers Fig 3. Mouse iPSC Colonies X Axis: Cell Types Differentiated Multipotent Pluripotent Totipotent Y Axis: Normalized Expression Levels Fig 4. Human iPSC Colony