Download
1 / 37
370 likes | 529 Vues
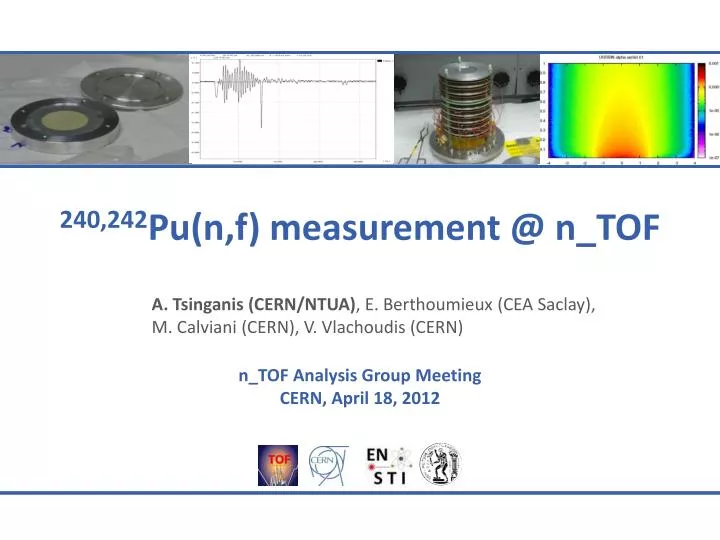
240,242 Pu( n,f ) measurement @ n_TOF. A. Tsinganis (CERN/NTUA) , E. Berthoumieux (CEA Saclay ), M. Calviani (CERN), V. Vlachoudis (CERN). n_TOF Analysis Group Meeting CERN, April 18, 2012. Outline. Samples & detector Preamplifier box Analysis routine RAW2DST conversion

E N D
240,242Pu(n,f) measurement @ n_TOF A. Tsinganis (CERN/NTUA), E. Berthoumieux (CEA Saclay), M. Calviani (CERN), V. Vlachoudis (CERN) n_TOF Analysis Group Meeting CERN, April 18, 2012
Outline • Samples & detector • Preamplifier box • Analysis routine • RAW2DST conversion • Amplitude spectra, background, α-FF separation • Simulations • Summary, working plan 240,242Pu(n,f) measurement @ n_TOF n_TOF Analysis Group Meeting – CERN, April 18, 2012 | A.T.
Samples • Eight (8) samples (4 x 240Pu, 4 x 242Pu) received from IRMM (Geel) • 3 cm diameter PuO2 deposit • 0.25 mm aluminium backing (5cm diameter) 240,242Pu(n,f) measurement @ n_TOF n_TOF Analysis Group Meeting – CERN, April 18, 2012 | A.T.
The Micromegas detector • MICRO-MEshGAseousStructure • Wireless gaseous detector • Drift electrode • Drift space (mm) • Primary ionisation and charge drift • Micromesh • Amplification region (25-50μm) • Charge multiplication • Readout • Already used for beam monitoring at n_TOF • 10B(n,α) and 235U(n,f) • Advantages • Low background (transparent detector) • Fast signal • Robustness, radiation hardness • Stability for long runs • Little material 240,242Pu(n,f) measurement @ n_TOF n_TOF Analysis Group Meeting – CERN, April 18, 2012 | A.T.
The Micromegas chamber • Designed to hold up to 10 samplesand microbulkMicromegas detectors • BNC connections for signals and HV • Aluminium chamber • Kapton windows • Gas mixture • 88% Ar : 10% CF4 : 2% iso-C4H10 (isobutane) • p = 1 bar 240,242Pu(n,f) measurement @ n_TOF n_TOF Analysis Group Meeting – CERN, April 18, 2012 | A.T.
Mounting the samples and detectors • Detectors mounted on the internal frame • Finally, the setup looks like this 240,242Pu(n,f) measurement @ n_TOF n_TOF Analysis Group Meeting – CERN, April 18, 2012 | A.T.
Mounting the samples • A 235U sample (for reference) and an empty frame also mounted • Samples and connection arranged as shown 10 9 8 7 6 5 4 3 2 1 Vm CAEN multi-channel HV supply BEAM EMPTY Pu-240 Pu-242 U-235 240,242Pu(n,f) measurement @ n_TOF n_TOF Analysis Group Meeting – CERN, April 18, 2012 | A.T.
Mounting the detector in the EAR • Micromegas chamber placed downstream from the TAC (@188.7m) • 16-channel preamplifier (10 channels used) • Constructed at INFN-Bari, based on FIC electronics • Electronic protection in place to prevent channel breakage (partially effective) neutrons neutrons 240,242Pu(n,f) measurement @ n_TOF n_TOF Analysis Group Meeting – CERN, April 18, 2012 | A.T.
Preamplifier performance • Shielding of the pre-amp was necessary during 2011 run to reduce post- γ-flash baseline oscillations • EAR-1 grounding was improved during winter shutdown • At beginning of 2012 data-taking, behaviour of U-235 signal in MGAS was noticeably better, while FIMG signals showed (almost) the same behaviour • MGAS signals are routed through the pre-amp prototype • Metal box, slightly different internal connections: either or both could be reasons for the difference • TEST: two FIMG detectors were tested with the MGAS pre-amp • The same improvement was observed • Both pre-amp boxes were taken to the EN Dept. electronics lab (C. Mitifiot) • Repair broken channels on FIMG pre-amp, attempt to improve internal connections/grounding • Connect remaining channels on MGAS pre-amp (only 3 were connected) • After the intervention, the FIMG pre-amp was connected to the MGAS • There is no visible improvement… • The prototype pre-amp is now used for the FIMG • Very big improvement in γ-flash response… • …except in one channel 240,242Pu(n,f) measurement @ n_TOF n_TOF Analysis Group Meeting – CERN, April 18, 2012 | A.T.
The prototype pre-amp • Metallic box • Remaining channels have been connected • 6 channels are broken (probably from 2011 tests) • Channel 10 behaves differently neutrons 240,242Pu(n,f) measurement @ n_TOF n_TOF Analysis Group Meeting – CERN, April 18, 2012 | A.T.
Preamplifier performance BEFORE AFTER With the 2012 data, it should be possible to push the measurement to higher energies 240,242Pu(n,f) measurement @ n_TOF n_TOF Analysis Group Meeting – CERN, April 18, 2012 | A.T.
Preamplifier performance U-235 240,242Pu(n,f) measurement @ n_TOF n_TOF Analysis Group Meeting – CERN, April 18, 2012 | A.T.
Analysis routine • In its previous form, the peak search routine could not discriminate overlapping pulses • The routine has been improved • Locates peaks looking for local maxima and minima • It is still a problem to determine the signal time for overlapping signals 240,242Pu(n,f) measurement @ n_TOF n_TOF Analysis Group Meeting – CERN, April 18, 2012 | A.T.
RAW2DST conversion problems • DST creation crashed when “plugging in” the analysis routine • The cause of the crash is not in the pulse search algorithm • Apparently the DST production software was not designed to handle such high numbers of events (e.g. ~70000 events per 80ms “movie” for Pu-240) • It has not been determined where exactly the code fails • The problem was temporarily bypassed by setting a high threshold (20 channels) to reduce the number of recognised pulses • This impacts the study of the α-FF separation • …although it considerably speeds up the processing of files... • This issue will need to be addressed and resolved 240,242Pu(n,f) measurement @ n_TOF n_TOF Analysis Group Meeting – CERN, April 18, 2012 | A.T.
Extracting neutron flux from U-235 • As a check, the neutron flux was extracted from the U-235 data • (Apart from the resonance region where the simple interpolation of the ENDF 235U(n,f) cross section is inadequate) dN/dlnE/7E12p En log[eV] 240,242Pu(n,f) measurement @ n_TOF n_TOF Analysis Group Meeting – CERN, April 18, 2012 | A.T.
Extracting neutron flux from U-235 • The extracted flux looks reasonable, but it is not directly comparable with the evaluated flux which is calculated at ~183m, and also because of the beam interception factor which is <1 for the FIMG samples • How do the two fluxes look relative to each other? 240,242Pu(n,f) measurement @ n_TOF n_TOF Analysis Group Meeting – CERN, April 18, 2012 | A.T.
Amplitude spectra – Pu-242 En < 5MeV 0.1 MeV < En < 5 MeV 240,242Pu(n,f) measurement @ n_TOF n_TOF Analysis Group Meeting – CERN, April 18, 2012 | A.T.
Amplitude spectra – Pu-240 En < 5MeV 0.1 MeV < En < 5 MeV • The α – fission fragment separation in Pu-240 will be quite challenging 240,242Pu(n,f) measurement @ n_TOF n_TOF Analysis Group Meeting – CERN, April 18, 2012 | A.T.
Amplitude spectra – U-235 En < 5MeV 0.1 MeV < En < 5 MeV 240,242Pu(n,f) measurement @ n_TOF n_TOF Analysis Group Meeting – CERN, April 18, 2012 | A.T.
Beam-off background (α + spontaneous fission) En < 5MeV 0.1 MeV < En < 5 MeV • Pu-242 240,242Pu(n,f) measurement @ n_TOF n_TOF Analysis Group Meeting – CERN, April 18, 2012 | A.T.
Beam-off background (α + spontaneous fission) En < 5MeV 0.1 MeV < En < 5 MeV • Pu-240 240,242Pu(n,f) measurement @ n_TOF n_TOF Analysis Group Meeting – CERN, April 18, 2012 | A.T.
Beam-off background (α + spontaneous fission) En < 5MeV 0.1 MeV < En < 5 MeV • U-235 240,242Pu(n,f) measurement @ n_TOF n_TOF Analysis Group Meeting – CERN, April 18, 2012 | A.T.
Amplitude cuts - efficiency • Choosing the appropriate amplitude cuts and estimating the detection efficiency for each detector is one of the key points to be addressed in the analysis of the Pu(n,f) data 240,242Pu(n,f) measurement @ n_TOF n_TOF Analysis Group Meeting – CERN, April 18, 2012 | A.T.
Simulations • Attempt to reproduce signals from α-particles and fission fragments • α-particles and fission fragments studied separately • Initial position sampled randomly within the sample volume • Particles emitted isotropically within 2π solid angle • Alpha-particle energy • ~ 5.2MeV (Pu-240) • ~ 4.9MeV (Pu-242) • ~ 4.4MeV (U-235) • Fission fragments • Mass and energy systematics from G.D.Adeev et al., Preprint INR 861/93 1993 240,242Pu(n,f) measurement @ n_TOF n_TOF Analysis Group Meeting – CERN, April 18, 2012 | A.T.
Simulations • Simplified geometry created in FLUKA • Simulation of samples and active detector volume • Energy deposition along z-axis is scored event-by-event • From energy deposition to charge (~26eV / electron-ion pair) Gas Sample dE/dz 240,242Pu(n,f) measurement @ n_TOF n_TOF Analysis Group Meeting – CERN, April 18, 2012 | A.T.
Simulations • Electron drift velocity calculated for given gas mixture as function of drift voltage • …using GARFIELD 240,242Pu(n,f) measurement @ n_TOF n_TOF Analysis Group Meeting – CERN, April 18, 2012 | A.T.
Simulations • Simplified geometry created in FLUKA • Simulation of samples and active detector volume • Energy deposition along z-axis is scored event-by-event • From energy deposition to charge (~26eV / electron-ion pair) • Electron drift velocity calculated for given gas mixture and drift voltage • …using GARFIELD • …we can thus calculate the current reaching the readout electrode • This signal is passed through a CR-RC circuit to obtain the final pulse • Typical amplifiers use a CR-(RC)4 circuit to achieve a quasi-gaussian pulse shape Gas V Sample dE/dz 240,242Pu(n,f) measurement @ n_TOF n_TOF Analysis Group Meeting – CERN, April 18, 2012 | A.T.
Simulations: data reconstruction • A large time window (few ms) is selected in which we can add: • White noise • α-particle and/or fission fragment pulses • …at appropriate rates 240,242Pu(n,f) measurement @ n_TOF n_TOF Analysis Group Meeting – CERN, April 18, 2012 | A.T.
Simulations: data reconstruction • Total signal: • To be optimised to match observed rise time, width etc. 240,242Pu(n,f) measurement @ n_TOF n_TOF Analysis Group Meeting – CERN, April 18, 2012 | A.T.
“Spin-off”: • Understanding different Micromegas signal shapes in fission tagging measurement • If it is due to the different emission angle (~0° vs. ~90°), the effect should show up when comparing simulated signals with small and large emission angles 240,242Pu(n,f) measurement @ n_TOF n_TOF Analysis Group Meeting – CERN, April 18, 2012 | A.T.
α-particle pile-up • α-activity of Pu samples is considerable • Using the standard equations for pile-up estimation (for the non-paralyzable case): • α- pile-up should be very limited in Pu-242 (~1%) • Over 30% pile-up probability in Pu-240! 240,242Pu(n,f) measurement @ n_TOF n_TOF Analysis Group Meeting – CERN, April 18, 2012 | A.T.
Simulations: α-pile-up • How does α-pile-up (in Pu-240) affect the α-particle amplitude spectrum? • Comparison of the real amplitude distribution of simulated α-particles with the distribution extracted by the pulse analysis routine • A long tail at higher amplitudes appears! • The overall detection efficiency decreases 240,242Pu(n,f) measurement @ n_TOF n_TOF Analysis Group Meeting – CERN, April 18, 2012 | A.T.
Simulations: α-pile-up 240,242Pu(n,f) measurement @ n_TOF n_TOF Analysis Group Meeting – CERN, April 18, 2012 | A.T.
Simulations: FF amplitude distribution • Simulated FF amplitude distribution • The behaviour seems different than the experimental one • Sharper decrease after peak, moving towards lower amplitudes • Possible influence of size of simulation step and corresponding dE/dx • To be investigated 240,242Pu(n,f) measurement @ n_TOF n_TOF Analysis Group Meeting – CERN, April 18, 2012 | A.T.
Acquired data • During 2011 run: data acquisition in parallel with C6D6 (Ni-58, U-236) and TAC (U-236) measurements • Total protons: • ~ 5 x 10¹⁸ (beginning of July – mid-September) • Still short of proposed 8.0 x 10¹⁸ • Furthermore, the proposal was based on higher mass and assuming fission collimator setup • Data taking for 2012 has begun (~3 weeks) • Beam time will be maximised, running in parallel with scheduled measurements 240,242Pu(n,f) measurement @ n_TOF n_TOF Analysis Group Meeting – CERN, April 18, 2012 | A.T.
Summary – analysis “road-map” • Preamplifier shielding and electronics issues should be studied in view of future measurements • Judging by the Micromegas detectors, the grounding intervention in EAR-1 does not seem to have had a significant effect • Analysis routine has been improved • Problem with DST files production remains and needs to be addressed • Simulations • We can now create realistic signals and extract amplitude spectra for various count-rates using the same pulse recognition routine used for the experimental data • Study α- pile-up effects • Understand α-background and effects on detector efficiency • Fine-tuning still necessary • Match rise-time, width etc. • Simulated dE/dx should be improved • Study FWHM/area vs. amplitude distributions • Determine appropriate amplitude cuts and detector efficiencies • Routine to extract Pu/U ratios has been written, but efficiencies need to be determined first • Data taking for 2012 has begun (~3 weeks) • According to present planning, Pu(n,f) measurement to continue in parallel for as long as possible 240,242Pu(n,f) measurement @ n_TOF n_TOF Analysis Group Meeting – CERN, April 18, 2012 | A.T.
The end 240,242Pu(n,f) measurement @ n_TOF n_TOF Analysis Group Meeting – CERN, April 18, 2012 | A.T.