Download
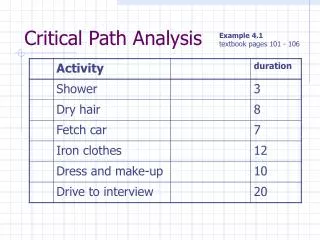
1 / 12
150 likes | 517 Vues
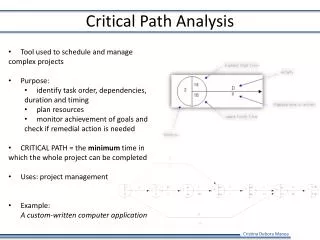
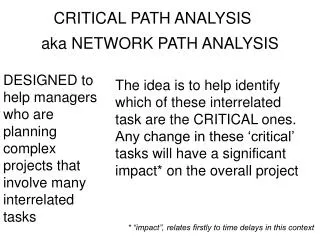
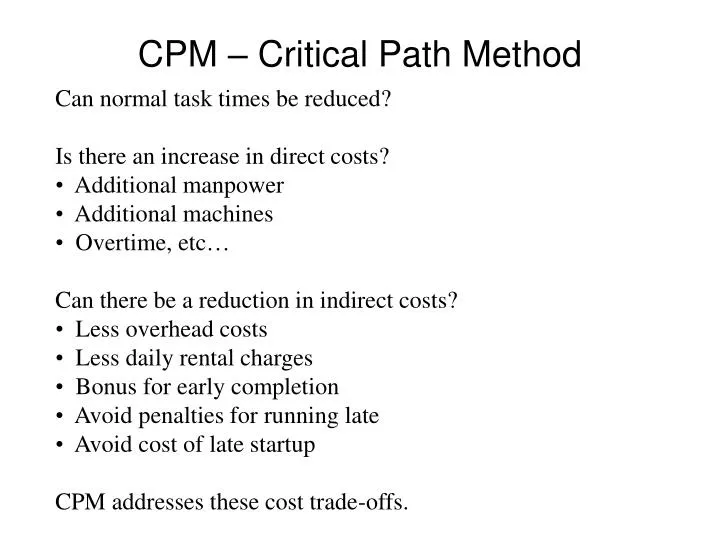
CPM – Critical Path Method. Can normal task times be reduced? Is there an increase in direct costs? Additional manpower Additional machines Overtime, etc… Can there be a reduction in indirect costs? Less overhead costs Less daily rental charges Bonus for early completion

E N D
CPM – Critical Path Method • Can normal task times be reduced? • Is there an increase in direct costs? • Additional manpower • Additional machines • Overtime, etc… • Can there be a reduction in indirect costs? • Less overhead costs • Less daily rental charges • Bonus for early completion • Avoid penalties for running late • Avoid cost of late startup • CPM addresses these cost trade-offs.
CPM – Critical Path Method Example: Overhead cost = $5/day
CPM – Critical Path Method Enumerative Approach: Reduce job H by 1 day: Total Cost improves by $5 - $4 = $1. Reduce job A by 2 days: Total cost improves by $10 - $8 = $2. Reduce job A by an additional day, and job B by a day? Total cost improves by $5 - $4 - $2 = -$1. Therefore do not take this action. Reduce job A by an additional day, and job C by a day? Total cost improves by $5 - $4 - $2 = -$1. Therefore do not take this action. Evaluate combinations of reducing path 3-4-6 and 3-5-6 by one day. D & E = $5 - $3 - $3 = -$1 F & E = $5 - $5 - $3 = -$3 D & G = $5 - $3 - $1 = $1 F & G = $5 - $5 - $1 = -$1 Therefore, reduce job D & G by 1 day: TC improves by $5 - $3 -$1 = $1. Overall improvement: $1 + $2 + $1 = $4.
CPM – Critical Path Method LP Approach: Let tij – decision variable for time to complete task connecting events i and j. kij – normal completion time of task connecting events i and j. lij – minimum completion time of task connecting events i and j. Cij – incremental cost of reducing task connecting events i and j. Model I: Given project must be complete by some time T, which tasks should be reduced to minimize the total cost? Min s.t. for all jobs (i,j) for all jobs (i,j) for all i
CPM – Critical Path Method LP Approach: Model II: Given an additional budget of $B for “crashing” tasks, what minimum project completion time can be obtained while staying within your budget? Min s.t. for all jobs (i,j) for all jobs (i,j) for all i
CPM – Critical Path Method LP Approach: Model III: Let $F represent the indirect cost which is proportional to the project duration. In other words, the indirect cost for the project is $F times the overall project duration, $F*T. Find the minimum project cost. Min s.t. for all jobs (i,j) for all jobs (i,j) for all i
PERT – Program Evaluationand Review Technique • CPM dealt with tasks having durations with known certainty. • PERT deals with tasks having uncertain durations. • PERT assumes tasks durations can be estimated with the following: • A most probable time, m. • An optimistic time, a. • A pessimistic time, b.
PERT – Program Evaluationand Review Technique PERT usually assumes a Beta distribution for tasks durations. An estimate for the mean, m, is the following: An estimate for the variance,s2, is the following:
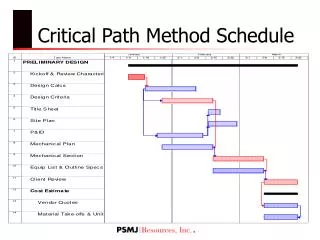
PERT – Determining Expected Project Duration Consider the following network: Note: Example 3.7-4 in book.
PERT – Determining Expected Project Duration Calculate the Average, Standard Deviation and Variance for each task duration.
PERT – Determining Expected Project Duration The network diagram with earliest and latest start times. What jobs are on the critical path? A-B-D-F-H-I What is the expected project completion time, T? E(T) = 5+9=4+13+6+8 = 45 days What is the variance of T? V(T) = 1+1+1+4+1+1 = 9 s(T) = 91/2 = 3 days
PERT – Determining Expected Project Duration Assuming all task durations are independent and identically distributed, IID, then T has a normal distribution with mean E(T) and variance V(T). Given E(T) = 45 days and s(T) = 3 days: What is the probability the project is completed within 45 days? P(T <= 45) = .50 What is the probability the project is completed with 40 days? P(T <= 40) = What is the probability the project is completed with 49 days? P(T <= 49) =