Download
1 / 69
690 likes | 771 Vues
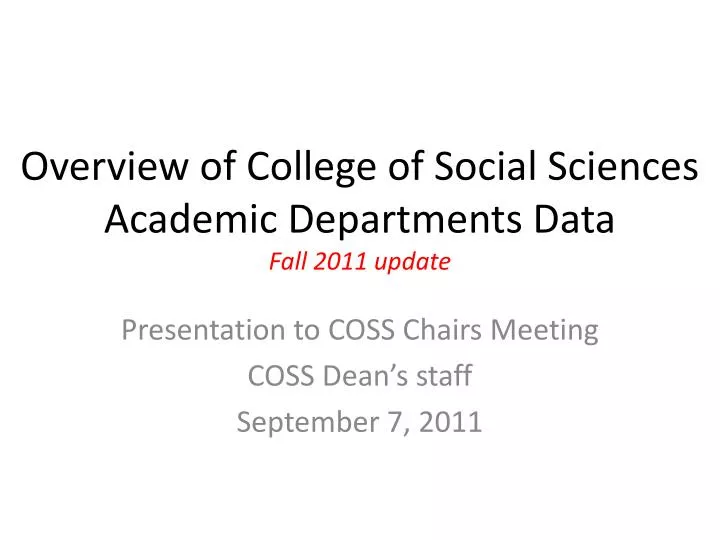
Overview of College of Social Sciences Academic Departments Data Fall 2011 update. Presentation to COSS Chairs Meeting COSS Dean’s staff September 7, 2011. Degree Programs in College of Social Sciences (as of August 2011). Bachelor of Arts (B.A.) Anthropology Mass Communications

E N D
Overview of College of Social Sciences Academic Departments DataFall 2011 update Presentation to COSS Chairs Meeting COSS Dean’s staff September 7, 2011
Degree Programs in College of Social Sciences (as of August 2011) • Bachelor of Arts (B.A.) • Anthropology • Mass Communications • Political Science • Psychology • Bachelor of Science (B.S.) • Criminology • Political Science • Sociology • Master of Arts (M.A.) • Criminology • Psychology • Sociology • Master of Public Administration (M.P.A.) • Master of Science in Urban and Regional Planning • Doctor of Philosophy (Ph.D.) in Psychology
COURSE ENROLLMENT NUMBERS –Fall 2011 *Note – not final (as of 8/29/11)
Spring and Summer 2011 UWG Graduates by College Note: First major only; tabulated from CA1665
Spring and Summer 2011 Graduates by Department Note: First major only; tabulated from CA1665
Five Year (06-07 to 10-11) UWG Total Students by Classification Note – Rounded numbers may not equal total
Spring 2011 UWG Total Students by College and Classification
UWG Change 2004-05 to 2010-11 • 2004-05 = 9,917 (8,008 undergraduates, 1,909 graduates) • 2010-11 = 10,828 (9,302 undergraduates, 1,526 graduates) • Growth of 9.2% total between 04-05 to 10-11 • Growth of 16.2% in undergraduates between 04-05 to 10-11 • Decline of 20.1% in graduates between 04-05 to 10-11 NOTE: Unofficial Fall 2011 numbers are significantly up for UGs and Grads
MAJORS (2004-05 THROUGH 2010-11 ACADEMIC YEARS)*Fall/Spring average
Averages:2004-05 = 34 2010-11 = 92 Should have 40 majors if comparable growth at UWG undergrad rate f/ 04-05 to 10-11
MAJORS (2004-05 THROUGH 2010-11 ACADEMIC YEARS)*Fall/Spring average
Averages: 2004-05 = 184 2010-11 = 257 Should have 214 majors if comparable growth at UWG undergrad rate f/ 04-05 to 10-11
Averages: 2007-08 = 1 2010-11 = 16
MAJORS (2004-2005 THROUGH 2010-11 ACADEMIC YEARS)*Fall/Spring average
Averages: 2004-05 = 215 2010-11 = 361 Should have 250 majors if comparable growth at UWG undergrad rate f/ 04-05 to 10-11
MAJORS (2004-2005 THROUGH 2010-11 ACADEMIC YEARS)*Fall/Spring average
Should have 217 majors if comparable growth at UWG undergrad rate f/ 04-05 to 10-11
Averages: 2004-05 = 21 2010-11 = 28
MAJORS (2004-2005 THROUGH 2010-11 ACADEMIC YEARS)*Fall/Spring average
Averages: 2004-05 = 393 2010-11 = 502.5 Should have 457 majors if comparable growth at UWG undergrad rate f/ 04-05 to 10-11
Averages: 2004-05 = 65 2010-11 = 78
Averages: 2008-09 = 9 2010-11 = 23