Download
1 / 32
340 likes | 480 Vues
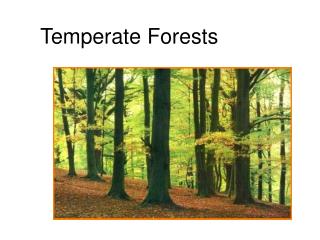
Status & issues of the World Forests. MCT course of IFS officers -Phase IV Indira Gandhi National Forest Academy , Dehradun 26 June 2013. Dr Devendra PANDEY Fmr DG, Forest Survey of India Fmr PCCF and Prl Secretary Forests, Arunachal Pradesh

E N D
Status & issues of the World Forests MCT course of IFS officers -Phase IV Indira Gandhi National Forest Academy , Dehradun 26 June 2013 Dr Devendra PANDEY Fmr DG, Forest Survey of India Fmr PCCF and Prl Secretary Forests, Arunachal Pradesh Email ID: dpandeyifs@rediffmail; pandeyd30@gmail.com
OVERVIEW OF WORLD’s FORESTS RESOURCE The interest in the world’s forests has grown due to awareness of their role in the global carbon cycle Mitigates climate change by reducing C emission due to deforestation and forest degradation and increasing C stock due to afforestation, conservation and SFM. Role of forest in conserving biodiversity and providing livelihood support for a large proportion of population has received prominence .
OVERVIEW OF WORLD’s FORESTS RESOURCE FAO of UN assesses world forest resource systematically and comprehensively every 5 years. Latest is of 2010. There are other agencies like JRC of European Commission, USGS, WRI etc. NOW China has also joined the race. FAO considers 7 thematic elements of SFM -extent of forest resource -forest biological diversity -forest health and vitality -productive function, -protective function -socio-economic functions and legal policy and institutional framework
World’s total forest in 2010 was about 4 billion ha or 31% of land area & per capita forests was 0.6 ha The five most forest rich countries constitute 53% i. Russia – 809 mn ha ii. Brazil – 520 mn ha iii. Canada- 310 mn ha iv.USA - 304 mn ha v. China- 207 mn ha Other countries in hierarchy are vi. DR Congo- 154 mn ha vii. Australia- 149 mn ha viii. Indonesia- 94 mn ha ix. Sudan – 70 mn ha x. India - 68 mn ha OVERVIEW OF WORLD’S FOREST RESOURCE
OVERVIEW OF WORLD’S FOREST RESOURCE • Around 13 million ha of forests were annually lost during 2000- 2010, mostly in tropical countries for agriculture & other purpose • The major loss has occurred in Brazil and Indonesia. About 4 million ha was lost in South America and 3.4 million ha in Africa • The net loss of forests has slowed down from 16 million ha per year during 1990-2000 • There is overall increase of forests in Asian region mainly due to large scale afforestation efforts of China • The net loss of forests is 5.2 million ha
OVERVIEW OF WORLD’s FOREST RESOURCE In Europe the status of forests is stable over the last 20 years, forest area extended but the focus of management shifted from productive to conservation About 13% of the world forests are legally established as PAs About 1% of the world’s forests are annually affected due to forest fire ( MODIS data) but affected area is severely under reported specially in Africa In North America (USA and Canada) and in Russia there is a significant loss of forests due to forest fires and insects and pests. Annual wood removal is about 3.4 billion m3 of which 43% constitute wood-fuel.
A New Independent Remote Sensing Survey by FAO Design Systematic sample of 10 km x 10 km, satellite image extracts at each 1-degree intersection of latitude and longitude. About 13,000 samples excluding no data sites. Globally, equivalent to a 1 percent sample of the Earth’s land surface. The Landsat provides global coverage and a long time-series of acquisitions suitable for the detection of changes in tree cover. Majority of imageries were provided by USGS for 1990, 2000 & 2005.
A New Independent Remote Sensing Survey • Partners FAO, USGS, JRC of European Commission and South Dakota University USA supported by countries. • Launched in 2008 and took almost 4 years to complete • Enhanced capacity in countries for monitoring, assessing and reporting on forests and land use changes
These results slightly differ from FRA
Results of the Global RS Survey • Results differ from FAO FRA assessments • Worldwide, the gross reduction in forests; -9.5 mn ha per year between 1990 and 2000 and -13.5 million ha per year between 2000 and 2005. • Reduction partially offset by gains due to afforestation and expansion of natural forest -6.8 million ha per year between 1990 and 2000 and -7.3 million ha per year between 2000 and 2005. • There is a net increase in boreal, temperate and sub-tropical forests and net loss in tropical forests
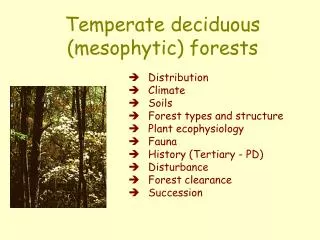
Distribution of boreal forests- Mostly in Canada, Alaska, Russia, Finland, Sweden, Norway
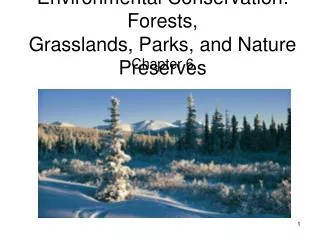
Key issues of the World forests (source: State of World’s Forests 2011, FAO) • Regional trends on forest resources (extent) • The development of the sustainable forest industries • Climate change adaption and mitigation • Local values of forests for sustaining livelihood of local communities including non-cash value of forests
Dynamics of carbon stock in forest ecosystem is the most robust parameter for climate change mitigation. • Measurement of C- stock of forests and its dynamics over a period has become the priority activity. • Capacity of most of the developing countries has be to built in this area specially for implementation of REDD+ mechanism – major challenge
Global Overview of C-Stock in forests(source: FAO, FRA 2010 of 233 Countries /territories)- reliability level • 180 countries reported on carbon in tree/woody biomass • 72 countries included deadwood and • 124 countries litter mostly default values (2.1 t/ha) • 121 countries reported on soil carbon mostly the default values as provided in the IPCC 2006 guidelines. • For filling the gaps for remaining countries and areas, FAO estimated carbon stocks by taking the sub-regional averages per hectare and multiplying these by the respective forest areas.
Global Overview of C-Stock in forests (source: FAO, FRA 2010) • Total C- stock in forest ecosystem = 652 billion tones • C-stock in total biomass (all four pools) =360 billion tones • C- stock in soil =292 billion tones • C- stock per ha forest ecosystem =162 tones • C- stock per ha in biomass = 90 tones • C- stock per ha in soil =72 tones • 44% in live biomass, 11% in deadwood and 45% in soil • During 2005-10 C stock in forest biomass decreased by 0.5Gt per year.
Five World Heritage Forest sites having highest C density in biomass (based on review of Biomass/carbon of 56 country reports) • Redwood National and State Parks of USA -573 t/ha (SOM 52 t/ha) • Olympic National Park of USA -419 t/ha (SOM 96 t/ha) • Te Wahipounamu South West New Zealand –253 t/ha (SOM 65 t/ha) • Central Suriname Reserve of Suriname -227 t/ha • (SOM 47 t/ha) • Tongariro National Park of New Zealand -208 t/ha • (SOM 65 t/ha)
Level of variability in C stock in forests • High variability in C stock in biomass = 16 to 573 t/ ha (high C density is found in West coast of USA/Canada in oceanic forests part and also in Redwood & Olympic NP USA) • Low variability in C stock of soil =25-132 t/ha ( high SOM lies in sub-tropical humid and temperate oceanic forests of Australia, tropical moist deciduous forests of Brazil, Lake Baikal, Virgin Komi Forests in boreal mountain forests of Russian federation)
STATUS OF INDIA’s FOREST India is among the few countries to have comprehensive operational system of forest cover monitoring In addition to forest cover, tree cover (tree groves less than 1 ha in area) is also estimated FSI undertakes these activities for the country biennially using remote sensing technology and results published in India State of Forest Report . Twelve Reports (last in 2011) have been published so far
OVERVIEW OF INDIA’s FOREST RESOURCE Area under different Forest types as per Champion & Seth (1968) classificaton as verified by latest study by FSI It has been found that broadly, about 17% Tropical Evergreen / semi evergreen category, 20% Tropical Moist Deciduous, 42 %Tropical Dry Deciduous, 2.3% Tropical Thorn, 5.7% Subtropical Pine and about 8% Himalayan Temperate category.
OVERVIEW OF INDIA’s FOREST RESOURCE National Forest Inventory (NFI) is also done to by laying sample plots on the ground but NFI is least publicized and discussed by media and others including academia About 4000 sample plots are laid systematically in selected about 30 districts of the country each year Assessment of Tree outside forests (TOF) resource is part of this activity Growing stock of wood in forests and TOF, biomass, carbon stock , bamboo resource are results of NFI
OVERVIEW OF INDIA’s FOREST RESOURCE Annual Timber production ( source: Forest Sector Report of India, ICFRE -2012) Forests 2.5 million m3 TOF 44.5 million m3 Imported 6.0 million m3
Carbon stocks in India’s forests (Million tonnes)
Trend of India’s Forest resource The total forest cover of the country is either stable or marginally increased There is no reliable data to comment on the degradation status of the forests at the national level. Per capita forest declined to 0.06 ha due to increased population. Comparing with USA, India’s geographic area is almost 1/3rd of the USA whereas the population is 4 times, thus population density is 12 times. Tree outside forests have become the major source of wood production in the country