Download
1 / 20
200 likes | 204 Vues
2013 Annual South Carolina Report Card Results (Education Accountability Act). Board Meeting November 12, 2013 Dr. Rodney Thompson, Superintendent Dr. Kevin O’Gorman, Chief Academic Officer. Purposes of the Report Card. Provide information about school performance

E N D
2013 Annual South Carolina Report Card Results(Education Accountability Act) Board Meeting November 12, 2013 Dr. Rodney Thompson, Superintendent Dr. Kevin O’Gorman, Chief Academic Officer
Purposes of the Report Card • Provide information about school performance • Assist in addressing strengths and weaknesses • Recognize high-performing and improving schools • Evaluate and focus resources on low-performing schools
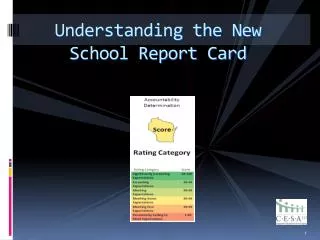
Report Card Ratings Absolute Rating: the Absolute Rating is a value of the school’s level of performanceon measures associated with student success during the school year on which the report card is based. Growth Rating: a measure of a school’s progress toward attaining and/or maintaining higher levels of performance.
Five Rating Terms • Excellent– Performance substantially exceedsthe standards for progress toward the SC Performance Goal. • Good – Performance exceeds the standards for progress toward the SC Performance Goal. • Average– Performance meets the standards for progress toward the Performance Goal. • Below Average – In jeopardy of not meeting the standards for progress toward the SC Performance Goal. • At-Risk – Performance fails to meet the standards for progress toward the SC Performance Goal.
What’s different? • Absolute Rating- 5th Year Graduation Rate (2nd year) • Growth Rating- Matched Student Data (45th Day from tested year and previous year)
Continuous Change – Federal Accountability 2001 NCLB • Adequate Yearly Progress • 37 Objectives • 40 Students to form subgroup • ALL or Nothing July 2012 ESEA State Wavier Awarded • All 4 Content Areas • More than triples the # of objectives • Based on Mean Scores rather than Passage Rate • Subgroup size different, Added male and female subgroups • A-F Rating assigned August 2013 ESEA State Wavier • Graduation Rate subgroups added • More than triples the # of objectives September 2013 ESEA State Wavier Amendment Requested
Continuous Change – State Accountability 2011-2012 • 5th Year Graduation Rate Added to formula 2012-2013 • Matched Student Data (45th Day) 2013-2014 • Bridge Year- Only items that can be matched to CCSS included • Matched Student Data (45th Day) – Different standards tested than prior year 2014-2015 • New Assessment – CCSS • Matched Student Data (45th Day) – Now PASS performance compared to New Test, New Standards assessment
Status Check • PASS Math Results • 5th Year Graduation Rate • Graduation Rate • EOC Results • HSAP Results • English Language Arts Focus
Status Check • Common Curriculum • Common Assessments • Professional Learning Communities • Professional Development • Standards Knowledge • Content Knowledge • Strategies for Differentiation • Assessments as a Tool
2013 District Ratings Summary • Neighboring districts • “Districts Like Ours” (within 10% poverty)