Download
1 / 20
210 likes | 356 Vues
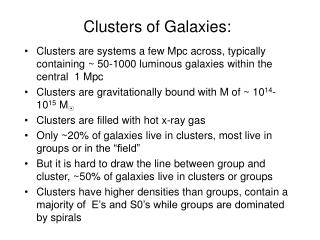
Formation and Evolution of Early-Type Galaxies in clusters. Yara Jaff é 1,2 Alfonso Arag Ó n-Salamanca 1 1. The University of Nottingham 2. European Southern Observatory. MAGPOP08 Paris, 12 Nov. 2008. OUTLINE. - Introduction - Scatter-age test - The data - Some results

E N D
Formation and Evolution of Early-Type Galaxies in clusters YaraJaffé1,2 Alfonso AragÓn-Salamanca1 1. The University of Nottingham 2. European Southern Observatory MAGPOP08 Paris, 12 Nov. 2008
OUTLINE - Introduction - Scatter-age test - The data - Some results - Conclusions
Universality of the CMR Evolution of m and b E’s evolved passively since formation at high z: Slope (m) Mass-metallicity relation Scatter(δ) due to small changes in tF z > 0: Mei et. al. 2006 z > 0: De Lucia et. al. 2007 z = 0: Bower, Lucey & Ellis 1992 z = 0: Visvanathan & Sandage1977
SF history: THE PARAMETER Available time Δt Spread in formation time t tF (look-back time since last episode of SF) tH (total age of the Universe) t=0 = Δt/ (tH- tF)
THE SCATTER-AGE TEST 1.Measure the observed scatter (σ) from the CMR 2.Compute δint by subtracting the errors introduced from the photometry 3. Colour evolution for different values of β using: 4. Comparison with population synthesis models
THE DATA ESO Distant Clusters Survey (EDisCS) Detailed follow-up of 20 clusters from LCDCS (Gonzalez et al. 2001) at 0.4 < z < 1 Each field containing a main cluster and some other secondary clusters and groups
EDisCS Sub-set of 137 early type galaxies (selected by morphology) in 10 clusters • Deep optical photometry from VLT (14 nights) White et al. 2005 • Near-IR photometry from NTT (20 nights) Aragon-Salamanca et al., in preparation • Multi-object spectroscopy with FORS2/VLT (25 nights) Halliday et al. 2004; Milvang-Jensen et al. 2008 • HST imaging for the of the highest-z clusters (80 orbits) Desai et al. 2007 • Narrow band Hα (3 clusters) and XMM data (3 clusters) Finn et al. 2005 and Johnson et al. 2006 respectively
AIM: To probe if the scatter or tF, for a fixed value of β, depend on: • The morphological sample (E´s vs. S0´s) • The cut in Luminosity (mass) • The colour chosen in the CMDs • Properties of the clusters ?
SOME RESULTS... 1. Individual analysis (cluster by cluster) 2. Overall analysis (all the clusters together)
CMDs of the clusters CL 1216.8-1201 z = 0.79 Age at z = 6.87 Gyrs ---------------------------- No. galaxies = 31 δint = 0.065 ± 0.009 residuals
d(R-I) / dtF MODEL COMPARISON CL 1216.9-1201 Bruzual & Charlot 2003 - SSP - 3 different metallicities - Chabrier's IMF - Low res. libraries - 0.1 Gyr of constant SF and then passive evol. - No dust attenuation Zsub-solar Zsolar Zover-solar d(R-I)/dtF R - I tF(Gyr)
DIFFERENT COLOURS (in CMDs) U V All the early-type galaxies In CL 1216.8 1201 (z~0.8) R-I I-J R-J V-I I-K V-J
DIFFERENT COLOURS β=1.0 β=0.3 β=0.1 ... tH(z)
SCATTERANALYSIS 1. Individual analysis (cluster by cluster) 2. Overall analysis (all the clusters)
SUB-SAMPLES All the galaxies in all the clusters Es S0s Lum Faint Low z High z Low σv High σv
RESIDUAL DISTRIBUTION δint=0.076-0.004+0.005 ( δint=0.063 )
= Δt / (tH- tF) All the sample: tF (Gyr) β=1.0 Δt(rf U-V) ~ 1.7 Gyr β=0.3 Δt(rf U-V)~ 1.0 Gyr β=0.1 Δt(rf U-V) ~ 0.5 Gyr .… tH(<z>) tF (Gyr) δint(rf U-V) δint(rf U-V)
PRELIMINARY CONCLUSIONS: • For CL 1216.8 1201 all the colours seem to give consistent tF(for β=0.3 and β=1.0) scatter about the CMR is due to age differences • The estimated tFdoesn’t seem to change much (within errors) with galaxy luminosity (mass), morphology or cluster propperties (vel. disp and z) but some trends are found