Download

1 / 18
180 likes | 361 Vues
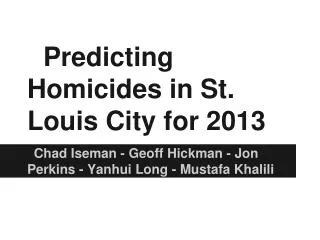
Project Overview. Goal To predict violent nonsexual crimes in the city of St. Louis for 2011. Specifically Unlawful Murders Scope Murders, Aggravated Assaults and Robberies for The city of St. Louis Year 2011. Predictors and Methods Used. Predictors and Methods Used. Predictors

E N D
Project Overview • Goal • To predict violent nonsexual crimes in the city of St. Louis for 2011. • Specifically Unlawful Murders • Scope • Murders, Aggravated Assaults and Robberies for • The city of St. Louis • Year 2011
Predictors and Methods Used Predictors and Methods Used Predictors • St. Louis city crime data for years 2005 – 2010 • US Census data for year 2000 • Abandoned Building data for years 2005-2010 Methods • Regression • Averaging • Quantitative Mapping
Avg Murders for Years 2005-2010 Avg Robberies for Years 2005-2010
Avg Murders for Years 2005-2010 AvgAgg Assaults for Years 2005-2010
Avg Murders for Years 2005-2010 Avg Abandoned Buildings for Years 2005-2010
Predictors and Methods Used Correlation Factors Considered
The Regression Equation • # of Murders = -0.208+0.033(AggAssult)+0.00614(AbnBld) -0.00758(Robbery)+0.00614(Unemp%) • R = 77% R2 = 78% which means there is a 78% change in murders due to our predictors • Robberies and Assaults Weighted by Year • .5 for 2010 • .3 for 2009 • .2 for 2008 • Abandoned Buildings from 2010 • Unemployment from Census Data
2011 Murder Map • This Map Represents 147 Murders Past Years Murder Totals: 2010 - 143 2009 - 142 2008 - 162 2007 - 134 2006 - 125 2005 - 129
Data Sources • St. Louis Metro police depthttp://www.slmpd.org/crime_stats.html • St. Louis City Interactive Mapping http://stlcin.missouri.org/mapportal/ • Geo St. Louis http://stlcin.missouri.org/citydata/newdesign/statsselector.cfm?type=data&geo=neigh