Download
1 / 16
160 likes | 296 Vues
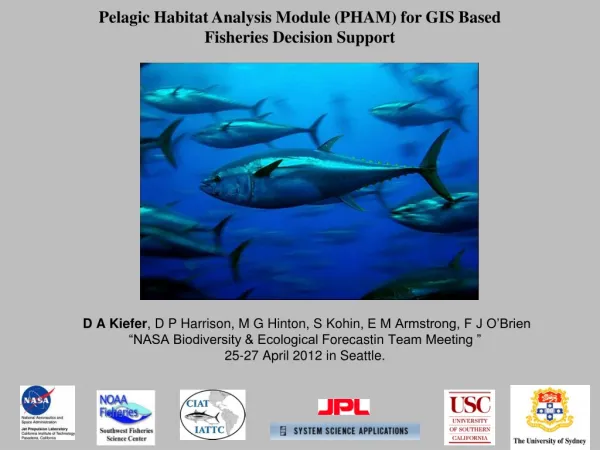
Pelagic Habitat Analysis Module (PHAM) for GIS Based Fisheries Decision Support. D A Kiefer , D P Harrison, M G Hinton, S Kohin , E M Armstrong, F J O’Brien “NASA Biodiversity & Ecological Forecastin Team Meeting ” 25-27 April 2012 in Seattle. Pelagic Habitat Analysis Module (PHAM).

E N D
Pelagic Habitat Analysis Module (PHAM) for GIS Based Fisheries Decision Support D A Kiefer, D P Harrison, M G Hinton, S Kohin, E M Armstrong, F J O’Brien“NASA Biodiversity & Ecological Forecastin Team Meeting ” 25-27 April 2012 in Seattle.
Pelagic Habitat Analysis Module (PHAM) Fisheries Catch/Survey Data: IATTC, SWFSC Tagging Data: FishTracker, Tagbase Satellite Imagery: SSH,SSChl,SST Circulation Model: ECCO-2 EASy GIS PHAM Tools & Statistics visit runeasy.com Dynamic Maps of Habitat Data & Results of Statistical Analysis
Batch File Database Imagery GE/GM Reg. Data EASy Spatial Analysis Architecture Desktop Custom Data NetViewer Spatial Analysis Service Script File PNG File EOF XLS Data File ‘R’ GoogleEarth EASy GoogleMaps ‘R’ Interface GE/GM Files EASy Infrastructure Google PHAMLite
PHAM blob plot of skipjack catch per set during 1997 El Nino superimposed upon SEAWiFS imagery of sea surface chlorophyll. Note movement of catch to the north of northern fish, general decrease in concentration of chlorophyll, and extremely clear and unproductive water at convergence zone at 5 N.
PHAM blob plot of skipjack catch per set during 1999 La Nina superimposed upon SEAWiFS imagery of sea surface chlorophyll. Note movement of catch towards equator, general increase in concentration of chlorophyll, and disappearance of clear and unproductive water at 5 N.
Michael Domeier Marine Conservation Science Institute • Using electronic tagging data to estimate movement, identify habitat, and characterize behavior of marine pelagic predators • Goals of thesis • Develop visualization tools & analytical methods for electronical tag data • Apply to two species (striped marlin, great white shark) to investigate three-dimensional movements in relation to their short-and long-term life history strategies in the environment
Eastern Pacific Light level sunset sunrise Day Night Day Cri-16
Cube 92 Aviso SSH
EOF and Linkage to Global Circulation Models Cube92PC 1: 16.54% AvisoPC1: 14.31% Cube92PC 1: 6.16% AvisoPC1: 6.81% Cube92PC3: 5.08% AvisoPC3: 4.43%
The temporal expansion coefficients for mode 2 and 3 closely track the recruitment of skipjack as well as the bigeye and yellowfin tuna. It appears likely that such information will provide new and improved estimates for the stock assessment models.
Conclusions • Software Development • PHAM-R interface expanded • EOF analysis of satellite imagery • GAM Habitat Modeling • Launching JPL Netviewer, • Stock Assessment Models a challenge but … PHAM international • workshops • Dynamics of Coupled Natural and Human System: Individual based modeling from tuna distribution to fleet operations to fishery management- driven by satellite SST, SSChl, and SSH • Scientific Insights • Established influence of ENSO perturbations on tuna recruitment & stock • assessment • Tracking of fleet movements with fronts and eddies • Linkage between depth of hypoxic waters and tuna fishing grounds- • predictions of industrial response to climate change. • Climate change and EOF series. • Validation of ECCO-2 (currents & phytoplankton)/SSH Imagery