Download
1 / 18
180 likes | 279 Vues
Randomization and stratification — a model analysis at different variation scenarios. Swedish Museum of Natural History. Anders Bignert , Dep. of Contaminant Research 06.10.27. Timeseries. Tidsserier. Sampling frequency. SD(lr) = 0.35. Sampling period = 12 years.

E N D
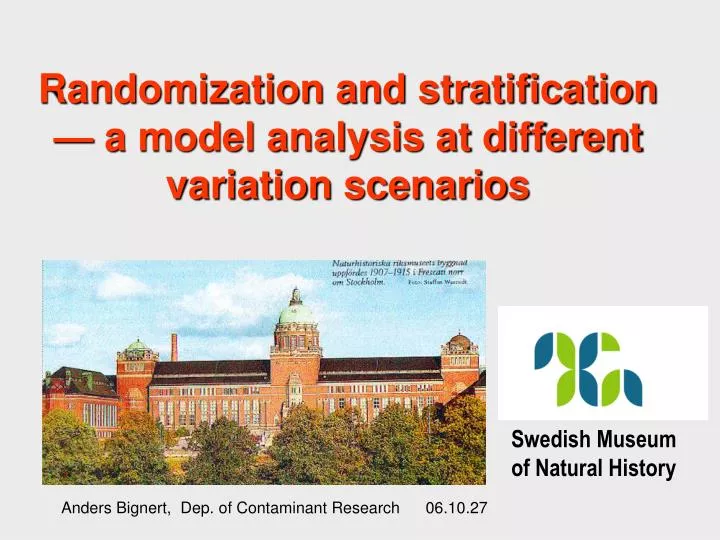
Randomization and stratification — a model analysis at different variation scenarios Swedish Museum of Natural History Anders Bignert, Dep. of Contaminant Research 06.10.27
Timeseries Tidsserier
Sampling frequency SD(lr) = 0.35 Sampling period = 12 years Power as a function of slope (annual change in %) at log-linear regression analysis at a residual standard deviation on a log-scale of 0.35, assuming normally distributed residuals. The graphs, from left to right, represent sampling every, every-second, third and fourth year, respectively based on Monte Carlo simulations at 10,000 runs.
Spatial monitoringObjectives? • Estimate mean and variance • Regional differences • Spatial trends • Level in relation to class limit
Sample variogram Figur II. Variogram som visar hur skillnaden mellan prov (CB-118, pg/g färskvikt i strömmingsmuskel från Bottenhavet) ökar med ökande avstånd.
N of species – n of samples (nets) Randomization technique
Unaligned square lattice design Random design Sobol sequence Sampling design
CV = 10% Distance to class limit: 25, 15, 10 , 5%
CV=20%, normal distributed Distance to class limit: 30, 25, 20, 15, 10% 10 > 34
CV=20%, Log-normal distribution Distance to class limit: 30, 25, 20, 15, 10% 34 > 50
random sampling Sobol sequence 75 > 53
random sampling ”Stratified” sampling 100 > 65
35% (normally distributed) variation were added (> total variation = 39 %) True mean = 2.5 pg/g. Distance to4.0, 3.5 and 3.0 pg/g (37.5%, 28%, 17%)
Afla-toxines in figs Tolerance limit
PCDD/DF - TEQ Herring, geometric mean Muscle