Download
1 / 12
120 likes | 259 Vues
Ohio River Monitoring and Assessment. Program Overview. ORSANCO Established in 1948. Total Budget - $40,000 2 Employees – Executive Director, Administrative Assistant Headquarters Office Support of Commissioner Travel Not enough $$ to do any monitoring.

E N D
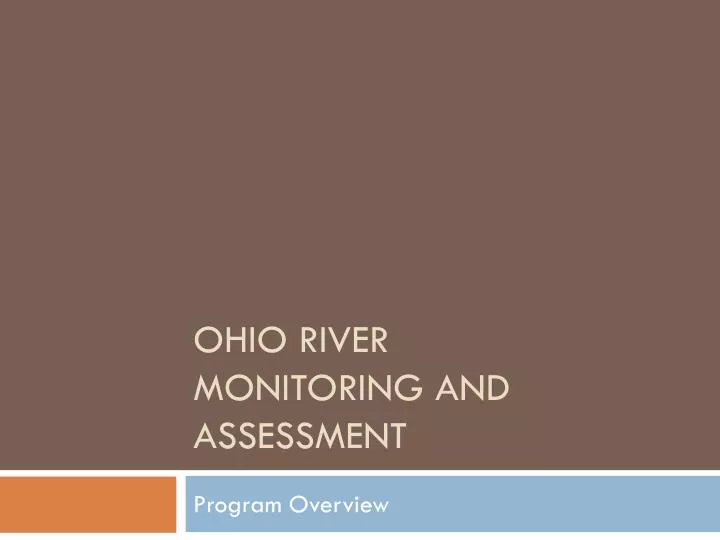
Ohio River Monitoring and Assessment Program Overview
ORSANCO Established in 1948 • Total Budget - $40,000 • 2 Employees – Executive Director, Administrative Assistant • Headquarters Office • Support of Commissioner Travel • Not enough $$ to do any monitoring
Monitoring in the 1950s: the Water Users Network • ORSANCO requested data from utilities and industries that monitored the river at their intakes. • Approximately 30 participants • Mostly physical parameters: Temp, pH, turbidity, hardness • No cost to ORSANCO • Parameters and monitoring frequency varied • No QC
Monitoring in the 1960s:Electronic Monitors • Technology developed in the late 50s with a Cincinnati electronics firm. • 4 primary parameters (Temp, pH, DO, Conductivity) • Additional parameters at times – chloride, sri, orp • Network consisted of 24 sites at its peak
Monitoring in the 1970s:Increased federal support • 106 grant nearly doubled Commission resources. • States decided to charge ORSANCO with monitoring and assessment of the Ohio River and lower reaches of major tributaries • Monitoring Strategy Team: states, US EPA, USGS, US COE • Ambient network: 36 sites (22 Ohio River, 14 tributary)
Monitoring in the 1970s: Fish Studies • Aquatic Life studies conducted in the 1960s, but not continued as routine program. • Lock Chamber studies begun in 1975 as ongoing effort. • Fish tissue analysis added in 1976.
Monitoring in the 1980s:Toxics Concerns • Organics Detection System established to monitor for unreported spills. • Increased resources for fish tissue analysis. • Special studies of portions of the river with high incidence of toxics.
Monitoring in the 1990s:Concern with Specific Use Protection • Electrofishing and macroinvertebrate sampling added to improve assessment of aquatic life support. • Bacteria monitoring redesigned to allow assessment of contact recreation support. • Wet weather studies in three urban areas • Atrazine monitoring for drinking water protection.
Monitoring in the 21st Century: Incorporatingnew technologies • High volume sampling • Mobile lab – use of Colilert • Additional pathogen analyses • Studies of emerging contaminants with US EPA, USGS
Current and Recent special studies • Nutrients and Algae • Total Dissolved Solid and Mineral Constituents • Mercury
Keys to Success • Commitment to good science • Dedicated resources • Collaboration