Download
1 / 43
430 likes | 555 Vues
2007 MCAE Survey of Basic Working Conditions. Total Completed Surveys 323. Respondents’ Age. WHAT IS YOUR AGE? 2.3% 20 to 24 years 12.9% 25 to 34 years 20.4% 35 to 44 years 25.6% 45 to 54 years 34.3% 55 to 64 years 4.5% 65 and older Part-Timers’ Responses: 2.6% 20-24 years

E N D
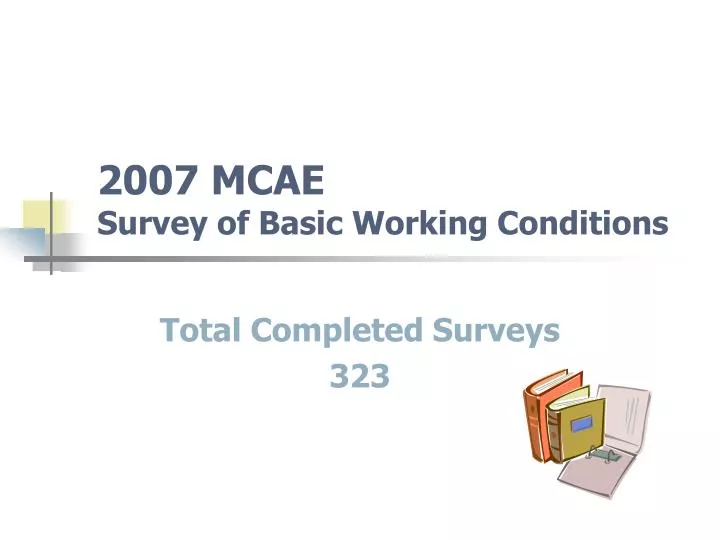
2007 MCAE Survey of Basic Working Conditions Total Completed Surveys 323
Respondents’ Age WHAT IS YOUR AGE? • 2.3% 20 to 24 years • 12.9% 25 to 34 years • 20.4% 35 to 44 years • 25.6% 45 to 54 years • 34.3% 55 to 64 years • 4.5% 65 and older Part-Timers’ Responses: • 2.6% 20-24 years • 11.4% 25-34 years • 19.7% 35-44 years • 21.2% 45-54 years • 38.3% 55-64 years • 6.7% 65 and older
Respondents’ Gender and Race WHAT IS YOUR SEX? • 85% Female • 15% Male Part-Timers’ Responses: • 86.9% Female • 13.1% Male WHAT IS YOUR RACE/ETHNICITY? 86.6% White 3.3% Hispanic or Latino (of any race) 2.3% Black or African American 4.3% Asian 0% American Indian/Alaska Native 0% Native Hawaiian/Other Pacific Isl. 3.6% Other Part-timers’ Responses: 87% White 3.1% Hispanic or Latino 2.6% Black or African American 2.6% Asian 4.7% Other
Respondents’ Education WHAT IS YOUR HIGHEST EDUCATIONAL LEVEL? • 60.2% Graduate or Professional Degree • 34% Bachelor’s degree • 3.2% Associate’s degree • 1.3% Some college, no degree • .7% High School graduate (includes equivalency) • .7% 9th to 12th grade (no diploma) Part-timers’ Responses: • 51.3% Graduate or Professional degree • 41% Bachelor’s degree • 4.7% Associate’s degree • 2.1% Some college, no degree • 1% High School graduate
Respondents’ Background Information DO YOU HAVE A TEACHER’S CERTIFICATION OR PROFESSIONAL LICENSE? • 53.7% Yes • 46.3% No We asked open-ended question: If YES, specify. Only 5 respondents (out of 101) had an ABE license (two of these were “provisional” licenses). Part-Timers’ Responses: • 56% Yes • 44% No ARE YOU ABLE TO STAY IN THE ABE/ESOL FIELD BECAUSE YOU HAVE OTHER FAMILY INCOME OR BENEFITS? 67.9% Yes, other income is a factor 29.5% No, other income is not a factor 2.6% Don’t know Part-timers’ Responses: 80.6% Yes, other income is a factor 16.2% No, other income is not a factor 3.1% Don’t know
Are you able to Work in ABE Because of Second Income? (Part-timers)
WHAT WAS YOUR FAMILY’S 2006 ANNUAL HOUSEHOLD INCOME (OPTIONAL) (230 responses; 93 skipped this question) .4% Less than $10,000 .4% $10,000 to $14,999 7.8% $15,000 to $24,999 10% $25,000 to $34,999 17% $35,000 to $49,999 20.9% $50,000 to $74,999 20.4% $75,000 to $99,999 17% $100,000 to $149,000 4.4% $150,000 to $199,999 1.7% $200,000 INDICATE YOUR ANNUAL SALARY, OR AN HOURLY RATE? This question was open-ended question and the responses were invalid. 43.6% of respondents reported annual salaries, and 74.2% reported an hourly rate (rate per direct instruction hour). We analyzed Part-Timers’ responses: 5 Part-timers provided their hourly rate: Range: $13.50/hr to $22.00/hr 3.4% Under $5,000 10.3% $5,000-$9,999 13.8% $10,000-$14,999 37.9% $15,000-$24,999 24.1% $25,000-$34,999 6.9% $35,000-$49,999 Respondents’ Salary and Income
Respondent’s Employment Status WHAT IS YOUR PRIMARY POSITION? • 55.1% ABE/GED/ESOL Teacher • 14.6% Program Director • 10.5% ABE/ESOL Coordinator • 8.1% Other • 5.6% Counselor • 2.2% Clerical/Non-Teaching Staff • 1.9% Professional Staff Dev. Coord. • 1.6% Tech Coordinator • .3% Teacher’s Aide WHAT ARE SECONDARY JOBS THAT YOU HOLD IN THIS POSITION? 50.5% Other 28.8% ABE/GED/ESOL Teacher 21.4% Counselor 11.2% Professional Staff Dev. Coord. 8.4% Clerical/Non-teaching Staff 7.7% ADA Coordinator 7.4% ABE/ESOL Coordinator 6.8% Tech Coordinator 3.1% Program Director 1.6% Teacher’s Aide
Respondent’s Employment Status ARE YOU EMPLOYED FULL-TIME OR PART-TIME? • 63.2 % Part-time • 36.8% Full-time HOW MANY HOURS DO YOU WORK PER WEEK? (Open-ended question) Part-Timers’ Responses (204): • 29.7%10 hours or less • 34.3% 11-20 hours • 25.7% 21-30 hours • 10.3% 31-40 hours
Respondent’s Employment Status ARE YOU WORKING FOR MORE THAN ONE EMPLOYER? • 70.3% No • 29.8% Yes We asked Open-ended question: If yes, are other jobs also in ABE/ESOL field? If you are working in another job in ABE/ESOL field, please complete separate survey for each job. Part-Timers’ Responses (204): • 69% No • 31% Yes (53.7% in the ABE/ESOL Field) HOW IS YOUR POSITION PRIMARILY FUNDED? 56% Government Grants 28.5% Mixed Sources 6.8% Don’t know 5.0% Other 3.7% Private Foundation Grants
HOW MANY YEARS HAVE YOU BEEN EMPLOYED BY YOUR CURRENT EMPLOYER? (Open-ended) Time of employment ranged from 1 month to 42 years. Respondents’ Employment Status
Respondents’ Employment Status How many years have you been employed by your current employer (continued from previous slide). Part-Timers’ Responses (204): • 58.3% 5 years or less • 20.8% 6-10 years • 11.8% 11-15 years • 2.1% 16-20 years • 4.0% More than 20 years
Respondents’ Employment Status HOW MANY TOTAL YEARS HAVE YOU WORKED IN THE ABE/ESOL FIELD? • 7.4% Less than 1 year • 18.6% 1 to 3 years • 22% 4 to 7 years • 14.6% 8 to 11 years • 8.4% 12 to 14 years • 29.1% 15 years or more Part-Timers’ Responses (204): • 8.3% Less than 1 year • 25% 1 to 3 years • 26.5% 4 to 7 years • 13.7% 8 to 11 years • 4.9% 12 to 14 years • 21.6% 15 years or more
Respondents’ Employment Status Comparison of Part-timer’s Time employed by Current Employer to Time Years Working in ABE/ESOL field:
Respondents’ Employment Status DO YOU CURRENTLY WANT TO WORK FULL-TIME IN THE ABE/ESOL FIELD? 53.3% Yes 32.8% No 13.9% Don’t know Part-Timer’s Responses: 33.3% Yes 48.5% No 18.1% Don’t Know
DO YOU CURRENTLY WANT TO WORK FULL-TIME IN THE ABE/ESOL FIELD? (part-timers)
Respondents’ Employment Status IS YOUR PROGRAM’S STAFF MOSTLY FULL-TIME OR PART-TIME EMPLOYEES? • 73.1% Mostly part-time • 13.3% Mostly full-time • 10.2% Equal numbers of FT/PT • 3.4% Don’t know Part-timers’ Responses: • 84.8% Mostly part-time • 6.9% Equal numbers of FT/P • 3.9% Mostly FT • 4.4.% Don’t know
Respondents’ Employment Status WHAT IS THE GEOGRAPHIC LOCATION OF YOUR PROGRAM? • 29.1% Greater Boston • 22.8% Southeast MA • 20% Northeast MA • 18.4% Central MA • 9.1% Western MA • .6% Other WHAT IS THE TYPE OF ABE/ESOL PROGRAM WHERE YOU WORK? 38.4% Community-based organization/ non-profit agency 27.6% School Department/LEA 16.7% College/University-based 6.2% City-town operated 3.1% Other 2.5% Don’t know 1.9% Corrections 1.9% Union .9% Library .9% Faith-based
Compensation & Benefits(abbreviated) WHAT HEALTH BENEFITS ARE YOU ELIGIBLE TO RECEIVE FROM YOUR JOB? • IndividualFamily Group • Health Insurance 38.7% 51.6% 9.7% • Vision Insurance 40% 46.7% 13.3% • Dental Insurance 36.8% 52.6% 10.6% Part-timers’ Responses: • Only 23.5% of Part-timers receive health benefits. • 24.1% of Part-timers who work for more than one employer receive health benefits. Percentage of part-timers who receive health benefits by hours worked per week: (N=24.1%) • 4% 10 hours or less • 6.3% 11-20 hours a week • 8.6% 21-30 hours a week • 5.2% 31-40 hours a week
Compensation & Benefits(abbreviated) • WHAT BENEFITS ARE YOU ELIGIBLE TO RECEIVE FROM YOUR JOB? • 33.3% Pension • 31.5% 401k/403b • 28.5% Life insurance • 18.7% Disability insurance, long-term • 16.9% Disability insurance, short-term • 2.6% Auto insurance • 9.4% Credit union • .8% Childcare • 55.1% Paid vacation • 57.3% Paid sick days • 52.1% Paid holidays • 62.2% Direct Deposit • 17.2% Tuition Reimbursement • 2.6% Tuition Remission • 49.1% Reimbursement for Travel to conferences • 33.7% Paid membership to professional organizations • 15% Union membership • 13.9% Other ARE YOUR BENEFITS ADEQUATE? 42.2% Yes 46.5% No 11.3% Don’t know We asked open-ended question: If NO, please comment.
Compensation & Benefits(abbreviated) DO YOU RECEIVE A FORMAL WRITTEN YEARLY PERFORMANCE EVALUATION? • 45.5% No -------------------------------------------------------------------------------------- HOW OFTEN DO YOU RECEIVE A RAISE? • 38.8% 3 or more years -------------------------------------------------------------------------------------- ARE YOU COMPENSATED FOR CANCELLATION OF A COURSE DUE TO UNFORSEEN CIRCUMSTANCES SUCH AS BAD WEATHER OR LACK OF ENROLLMENT? • 66.1 % No ------------------------------------------------------------------------------------- DO YOU HAVE AN UP-TO-DATE PERSONNEL POLICY MANUAL? • 60.1% Yes ------------------------------------------------------------------------------------- IS THERE CURRENTLY A GRIEVANCE PROCEDURE IN PLACE? • 50.3% Yes
Compensation & Benefits(abbreviated) DID YOU SIGN A CONTRACT WHEN YOU WERE HIRED FOR YOUR CURRENT POSITION? • 47.1% Yes • 47.1% No • 5.9% Don’t know DO YOU HAVE A JOB DESCRIPTION? • 76.6% Yes • 10.4% No • 13% Don’t know We asked open-ended: If YES, are your job responsibilities accurately reflected in your job description? ARE YOU A MEMBER OF A UNION? 79.6% No 20.4% Yes We asked open-ended question: If YES, please specify.
Compensation & Benefits(abbreviated) ARE YOU PAID FOR COMPENSATORY (COMP) TIME? • 56% No • 30% Yes • 14% Don’t know We asked open-ended question: If YES, describe how many hours can be taken, restrictions, etc. Part-timers’ Responses: • 54.4% No • 27.2% Yes • 18.3% Don’t know ARE YOU COMPENSATED FOR PREP TIME DONE AT HOME? 49.5% No 38.2% Yes 12.3% Sometimes Part-timers’ Responses: 38.3% No 47.2% Yes 14.5% Sometimes
Compensation & Benefits(abbreviated) ARE YOU COMPENSATED FOR PROFESSIONAL DEVELOPMENT ACTIVITIES? • 86.7% Yes • 9% No • 4.3% Don’t know Part-Timers’ Responses • 87.3% Yes • 6.9% No • 5.8% Don’t know
Program Support (abbreviated) DO YOU ATTEND STAFF MEETINGS? • 95.8% Yes • 4.2% No IF YES, HOW OFTEN DO YOU ATTEND STAFF MEETINGS? • 48.3% Monthly QUESTIONS RELATED TO STAFF MEETINGS: ARE YOU PAID TO ATTEND STAFF MEETINGS? 89.9% Often ARE THESE MEETINGS PRODUCTIVE? • 53.8% Often ARE THESE MEETINGS INCLUSIVE? • 74% Often ARE THESE MEETINGS INFORMATIVE? • 61.7% Often ARE THESE MEETINGS EMPOWERING? • 39.1% Sometimes DO YOU HAVE THE OPPORTUNITY TO PARTICIPATE IN HIRING NEW STAFF? • 50% Yes
Program Support (abbreviated) DO YOU FEEL THAT YOUR PROGRAM’S STAFF REFLECTS THE DEMOGRAPHICS (INCLUDING RACE, CULTURE, CLASS, GENDER, AGE, DISABILITY, SEXUAL ORIENTATION, RELIGION, OR IMMIGRATION EXPERIENCE) OF THE COMMUNITY SERVED BY THE ABE/ESOL PROGRAM? • 31.4% Does reflect • 42.8% Somewhat reflects • 23.5% Does not reflect • 2.3% Don’t know Part-timers’ Response: • 35.3% Does Reflect • 37.4% Somewhat reflects • 23.7% Does not reflect • 3.7% Don’t know
Program Support (abbreviated) PLEASE RATE YOUR WORK ENVIRONMENT. • 55.2% Temperature Average • 53.6% Restroom Average • 53.8% Cleanliness Average • 59.3% Air Quality Average • 35.7% Rodents/Vermin Excellent • 42.7% Overcrowding Average • 53.1% Quality of Equipment Average • 56.4% State of Facility Repair Average • 51.5% Fire Safety Average • 57.6% Security Average • 32.9% Access to Kitchen Poor • 31.4% Access to Break-room Excellent • 60.7% Access to Textbooks Excellent • 48% Access to Dedicated Classroom Excellent • 64.6% Access to Instructional Materials Excellent • 57% Access to Desk Excellent • 69% Access to Copy Machine Excellent • 64.3% Access to Computers Excellent • 65.8% Access to Internet/Email Excellent • 59.9% Access to Office Supplies Excellent