Download
1 / 56
580 likes | 734 Vues
Pixel and Image Characteristics. Prof. Arnon Karnieli The Remote Sensing Laboratory Jacob Blaustein Institute for Desert Research Ben-Gurion University of the Negev Sede-Boker Campus 84990, ISRAEL. Pixel (picture element).

E N D
Pixel and Image Characteristics Prof. Arnon Karnieli The Remote Sensing Laboratory Jacob Blaustein Institute for Desert Research Ben-Gurion University of the Negev Sede-Boker Campus 84990, ISRAEL
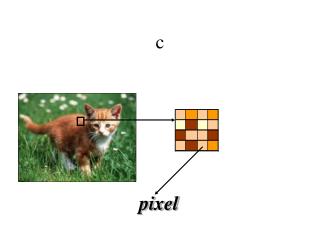
Pixel (picture element) A pixel having both spatial and spectral properties. The spatial property defines the "on ground" 2 dimensions. The spectral property defines the intensity of spectral response for a cell in a particular band.
Pixel Value Digital number (DN) = Gray Level (GL) = Brightness Value (BV)
Radiance to DN At sensor radiance DN Optical system, detectors, electronics (W m-2 sr-1m-1) Integer (bit) The output (DN) is proportional to the input (at sensor radiance)
A row of pixels A row of pixels represents a scan line collected as the sensor moves left to right or collected through the use of a linear array of photodetectors.
An image An image is composed of pixels geographically ordered and adjacent to one another consisting of 'n' pixels in the x direction and ‘m' pixels in the y direction.
One band When only one band of the EM spectrum is sensed, the output device (color monitor) renders the pixels in shades of gray (there is only one data set).
Multispectral color composite Multispectral sensors detect light reflectance in more than one or two bands of the EM spectrum. These bands represent different data. When combined into the red, green, blue guns of a color monitor, they form different colors.
True Color Composite Blue Green Red NIR SWIR1 TIR SWIR2
False Color Composite Blue Green Red NIR SWIR1 TIR SWIR2
SWIR Color Composite Blue Green Red NIR SWIR1 TIR SWIR2
Multispectral image A multispectral image is composed of 'n' rows and 'n' columns of pixels in each of three or more spectral bands. There are in reality more than one "data set" which makes up one image. These different data sets are referred to as spectral bands, bands, or channels.
Resolutions Resolution - The smallest observable (measurable) difference. • Resolutions: • Spatial • Radiometric • Spectral • Temporal
Spatial resolution • Spatial resolution • “A measure of the smallest angular or linear separation between two objects that can be resolved by the sensor” • Resolving power in the ability to perceive two adjacent objects as being distinct • Depends on: • - size • - distance • - shape • - color • - contrast characteristics • - sensor characteristics
Instantaneous Field of View (IFOV) • Instantaneous field of view (IFOV) is the angular field of view of the sensor, independent of height • IFOV is a relative measure because it is an angle, not a length.
Field of View (FOV) Instantaneous Field of View (IFOV) = Pixel Field of View (FOV) Flight direction
GIFOV H Ground projected Instantaneous Field of View (GIFOV) GIFOV depends on satellite height (H)
Resolution target 2 m 4 m
Different spatial resolutions 10 m 20 m 80 m 40 m
Different spatial resolutions 1,000 m 300 m 30 m 3 m
Shadow Mountain Eye Project Ninety 61 cm mirrors, 2.25 km across.
Common spectral sensors Other sensors: Landsat MSS - 80 m NOAA-AVHRR - 1,100 m Meteosat - 5,000 m
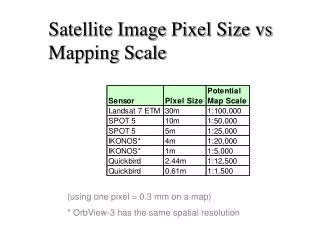
Scale Scale - mathematical relationship between the size of objects as represented on maps, aerial photographs, or images. Measured as the ratio of distance on an image to the equivalent distance on the ground. Example: 1:50,000 1 cm on the map represents 50,000 cm or 0.5 km on the ground
Radiometric resolution • Radiometric resolution • Number of digital levels that a sensor can use to express variability of brightness within the data • Determines the information content of the image • The more levels, the more details can be expressed • Determined by the number of bits of within which the digital information is encoded
Different Gray Levels 2 bit - 4 levels 3 bit - 8 levels 1 bit - 2 levels 4 bit - 16 levels 6 bit - 64 levels 8 bit - 256 levels
Cloud Shadow Part of the IKONOS (11-bit acquisition level) image is under cloud shadow. It can be recovered due to high radiometric resolution. The features under cloud shadow are recovered by applying a simple contrast and brightness enhancement technique.
Dynamic range Dynamic Range Dynamic Range
Spectral resolution • Spectral Resolution • The width and number of spectral intervals in the electromagnetic spectrum to which a remote sensing instrument is sensitive. • Allows characterization based on geophysical parameters (chemistry, mineralogy, etc.)
Multi- Super- Hyper- Ultraspectral • Multispectral: 3 – 10 spectral bands (Landsat-TM, SPOT-HRV, NOAA-AVHRR) • Currently the most common systems • Surperspectral: 10 – 100 spectral bands (MODIS, MERIS, Venµs) • Become more popular in recent years • Hyperspectral: A few hundreds of spectral bands (AVIRIS, Hyperion); • Near-future development • Ultraspectral: A few thousands of spectral bands. • Far-future development
Signal to Noise Ratio • Sensor responds to a both target brightness (signal) and electronic errors from various sensor components (noise) • signal = the actual energy reaching the detector • noise = random error in the measurement (all systematic noise has been removed) • SNR = signal to noise ratio = Signal/Ratio • To be effective, sensor must have high SNR
Signal to Noise Ratio Laboratory Kaolinite spectrum convolved in various signal to noises
Signal to Noise Ratio Landsat ALI
Temporal Resolution 1/ • Temporal resolution - the frequency of data acquisition over an area • Depends on: • - the orbital parameters of the satellite • - latitude of the target • - SWATH width of the sensor • - pointing ability of the sensor • Also called “revisit time”
SWATH 175 km 2800 km
Importance High temporal resolution is important for: - infrequent observational opprtunity (e.g., when clouds often obscure the surface) - short-lived phenomenon (floods, oil spills, dust storms, etc.) - rapid response (fires, hurricanes) - detection changes properties of a feature to distinguish it from otherwise similar features (phenology)