Download
1 / 13
130 likes | 251 Vues
Energy realities and climate challenges. Hege Marie Norheim, Senior vice president. Scale of the challenge. Abatement of world energy-related CO 2 emissions in the 450 Scenario. 42. Gt. World abatement by technology, 2030. Reference Scenario. 40. 38. OECD+. Efficiency - 57%. 36. 34.

E N D
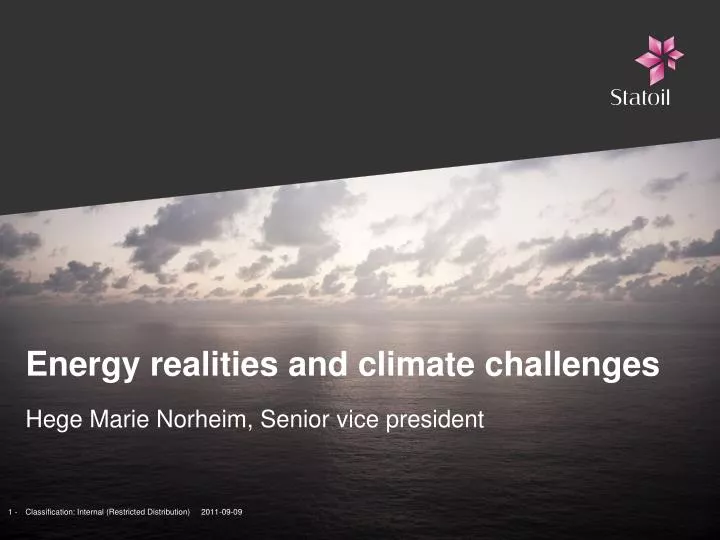
Energy realities and climate challenges Hege Marie Norheim, Senior vice president
Scale of the challenge Abatement of world energy-related CO2 emissions in the 450 Scenario 42 Gt World abatement by technology, 2030 Reference Scenario 40 38 OECD+ Efficiency - 57% 36 34 13.8 Gt 3.8 Gt 32 OME Renewables & biofuels - 23% 30 Nuclear - 10% OC 28 CCS - 10% 450 Scenario 26 2007 2010 2015 2020 2025 2030
Oil and gas in the future energy mix Share of world primary energy Source: World Energy Outlook 2010, IEA (2010)
7.8 * Offshore CO2 tax in Norway approx. 50$/tonn since 1992 Energy efficient oil and gas production CO2-emissions per produced barrel, kg Global average 19,0 * Statoil 7,0 Norway Europe Middle East Russia North- America Africa Source: OGP; OLF; Energinasjonen Norge
Norway Algeria Azerbaijan Gas - a competitive low carbon fuel for the future • An abundant energy source • Cost competitive • Most CO2 efficient of all fossil fuel Statoil - the 2nd biggest gas supplier to Europe Gas to power in Europe* Life cycle CO2 emissions per boe, Kg/MWh 921 425 30 10 Hydro Wind Nuclear NCS gas Coal *Source: OLF: Energinasjonen Norge
Making the green journey work Europe can meet its 2050 ambition of reducing its CO2-emissions by 80 per cent compared to 1990, in a faster and more cost-efficient way if natural gas plays a significant part in the energy mix. • Abundant • Sustainable • Affordable http://www.statoil.com/en/NewsAndMedia/News/2011/Pages/24Feb_EGAF.aspx
Reduction new coal plant Emissions old coal plant Reduction with new gas plant Emissions new gas plant Gas – major reductions NOW Gas-fired vs. coal-fired power CO2 emissions • Gas-fired power emits 70% less CO2 than old coal-fired plants • Renewables market share will grow, but technology development will take time • Gas is the most optimal base-load fuel to balance intermittent renewables supply Source: Deutsche Bank
Mongstad Full-scale Test Centre Mongstad Snøhvit LNG In Salah Statoil’s carbon capture & storage projectsAn industrial approach to climate change Building up our knowledge and experience Sleipner Application to new challenges 1996- 2004- 2008- 2011/12- 2018?
Renewable energy A focused approach utilizing our key competencies Statoil’s focus is to establish a position in markets where the company has natural advantages, particularly within offshore renewable energy 12 - 12 -
Thank you Presentation title Presenters name Presenters title E-mail address, tel: +00 00 00 00 www.statoil.com