Download
1 / 1
10 likes | 148 Vues
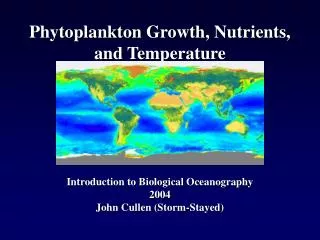
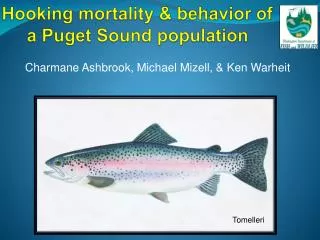
Kimberle Stark, King County Marine & Sediment Assessment Group kimberle.stark@kingcounty.gov Gabriela Hannach, King County Environmental Laboratory gabriela.hannach@kingcounty.gov. Chaetoceros eibenii. Noctiluca scintillans. Akashiwo sanguinea. Chaetoceros similis.

E N D
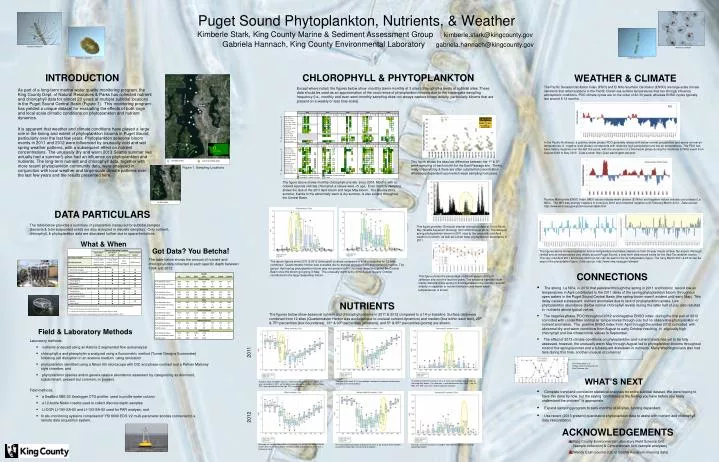
Kimberle Stark, King County Marine & Sediment Assessment Group kimberle.stark@kingcounty.gov Gabriela Hannach, King County Environmental Laboratory gabriela.hannach@kingcounty.gov Chaetoceros eibenii Noctiluca scintillans Akashiwo sanguinea Chaetoceros similis NUTRIENTS INTRODUCTION CHLOROPHYLL & PHYTOPLANKTON WEATHER & CLIMATE The figures below show seasonal nutrient and chlorophyll patterns in 2011 & 2012 compared to a 14-yr baseline. Surface data were combined from 12 sites (Quartermaster Harbor was excluded due to unusual nutrient dynamics) and median (line within each box), 25th & 75th percentiles (box boundaries), 10th & 90th percentiles (whiskers), and 5th & 95th percentiles (points) are shown. The Pacific Decadel Oscillation Index (PDO) and El Niño Southern Oscillation (ENSO) are large-scale climate variations that reflect patterns in the Pacific Ocean sea surface temperatures that can strongly influence atmospheric conditions. PDO climate cycles are on the order of 20-30 years, whereas ENSO cycles typically last around 6-12 months. Except where noted, the figures below show monthly (semi-monthly at 3 sites) chlorophyll-a levels at subtidal sites. These data should be used as an approximation of the occurrence of phytoplankton blooms due to the inadequate sampling frequency (i.e., monthly and even semi-monthly sampling does not always capture bloom activity, particularly blooms that are present on a weekly or less time-scale). Pt. Wells Puget Sound PDO Seattle N S Washington In the Pacific Northwest, a positive (warm phase) PDO generally relates with below normal precipitation and above normal air temperatures. A negative (cool phase) corresponds with relatively high precipitation and low air temperatures. The PDO has been mainly negative over the last five years, with the exception of a brief warm phase during the moderate El Niño event from August 2009 to May 2010. Data source: http://jisao.washington.edu/pdo Puget Sound Phytoplankton, Nutrients, & Weather Quartermaster Harbor monthly sites semi-monthly sites N The high ammonia-N values in June & early July followed degradation of the large May bloom. If a value was < method detection limit (MDL), the full MDL of 0.005 mg/L was used to calculate statistics. The lack of the April 2011 spring bloom resulted in increased nitrate/nitrite throughout the Central Basin. A typical silica drawdown occurs in April from the spring diatom bloom, but was not evident in 2011 as the bloom was delayed until May. The wet April 2011 also contributed to the high 2011 median value. East Passage This figure shows the absolute difference between the 1st & 3rd week sampling of each month for the East Passage site. Timing really is everything & there are often substantial concentration differences dependent upon which week sampling took place. Figure 1. Sampling Locations Elliott Bay S Seattle The figure above shows monthly chlorophyll-a levels since 2004. Months with no colored squares indicate chlorophyll-a values were <5 ug/L. Even monthly sampling shows the lack of the 2011 April bloom and large May bloom. The bloomy 2013 summer, thanks to the abnormally warm & dry summer, is also evident throughout the Central Basin. Quartermaster Harbor Positive Multivariate ENSO Index (MEI) values indicate warm phases (El Niño) and negative values indicate cool phases (La Niña). The MEI was strongly negative in June/July 2010 and remained negative until February/March 2012. Data source: http://www.esrl.noaa.gov/psd/enso/mei/table.html in situ sites DATA PARTICULARS Although not readily discernible on ths graph, the wetter than normal March in both 2011 & 2012 resulted in increased silica, particularly at sites near a freshwater input. The large September bloom following the warm & dry August-early October caused the September nitrate/nitrite drawdown. The high ammonia-N values in October followed degradation of the large September bloom. The table below provides a summary of parameters measured for subtidal samples (bacteria & total suspended solids are also analyzed in discrete samples). Only nutrient, chlorophyll, & phytoplankton data are discussed further due to space limitations. This figure provides 15-minute interval chlorophyll data at 1m in Elliott Bay (Seattle Aquarium mooring) from 2009 through 2012. The delayed spring phytoplankton bloom in 2011 (due to the unusually cold April weather) is shown, as well as overall lower phytoplankton abundance in 2011. What & When The figures above show precipitation and air temperature anomalies (departure from 30-year mean) at Sea-Tac airport. Although rainfall and air temperatures vary widely around Puget Sound, a long-term data record exists for the Sea-Tac weather station. The very cold April 2011 and lovely 2013 (so far) can be seen in the air temperature figure. The rainy March 2011 & 2012 can be seen in the precipitation figure. Data source: http://www.nws.noaa.gov/climate/ Got Data? You Betcha! The table below shows the amount of nutrient and chlorophyll data collected at each specific depth between 1994 and 2012. The above figures show 2011 & 2012 chlorophyll-a values compared to a 14-yr baseline for 12 sites combined. Quartermaster Harbor was excluded due to atypical phytoplankton and nutrient dynamics. The typical April spring phytoplankton bloom was not evident in 2011 but was large throughout the Central Basin once the bloom got going in May. The unusually warm & dry 2012 August to early October contributed to the large September bloom. As part of a long-term marine water quality monitoring program, the King County Dept. of Natural Resources & Parks has collected nutrient and chlorophyll data for almost 20 years at multiple subtidal locations in the Puget Sound Central Basin (Figure 1). This monitoring program has yielded a unique dataset for evaluating the effects of both large and local scale climatic conditions on phytoplankton and nutrient dynamics. It is apparent that weather and climate conditions have played a large role in the timing and extent of phytoplankton blooms in Puget Sound, particularly over the last few years. Phytoplankton seasonal bloom events in 2011 and 2012 were influenced by unusually cold and wet spring weather patterns, with a subsequent effect on nutrient concentrations. The unusually dry and warm 2013 Seattle summer (we actually had a summer!) also had an influence on phytoplankton and nutrients. The long-term nutrient and chlorophyll data, together with more recent phytoplankton community data, were analyzed in conjunction with local weather and large-scale climate patterns over the last few years and the results presented here. CONNECTIONS • The strong La Niña in 2010 that persisted through the spring in 2011 and historic record low air temperatures in April contributed to the 2011 delay of the spring phytoplankton bloom throughout open waters in the Puget Sound Central Basin (the spring bloom wasn’t evident until early May). This delay caused subsequent nutrient anomalies due to lack of phytoplankton uptake. Low phytoplankton abundance (below normal chlorophyll levels) during the latter half of July also resulted in nutrients above typical values. • The negative phase PDO throughout 2012 and negative ENSO index during the first part of 2012 coincided with cooler than normal air temperatures through July but no observable phytoplankton or nutrient anomalies. The positive ENSO index from April through December 2012 coincided with abnormal dry and warm conditions from August to early October resulting in atypically high chlorophyll and low nitrate/nitrite values in September. • The effect of 2013 climate conditions on phytoplankton and nutrient levels has yet to be fully assessed, however, the unusually warm May through August led to phytoplankton blooms throughout most of the spring/summer and a subsequent drawdown in nutrients. Many Washingtonians also had tans during this time, another unusual occurrence! This figure shows the percentage of diatom genera at the Pt. Jefferson site over the last five years. The seasonal transition from mainly diatoms in the spring to dinoflagellates in the summer and fall (mainly in response to nutrient limitation and warm water temperatures) is shown. Field & Laboratory Methods Laboratory methods: • nutrients analyzed using an Astoria 2 segmented flow autoanalyzer • chlorophyll-a and pheophytin-a analyzed using a fluorometric method (Turner Designs fluorometer) following cell disruption in an acetone medium using sonication • phytoplankton identified using a Nikon 50i microscope with DIC and phase-contrast and a Palmer Maloney style chamber, and • phytoplankton species and/or genera relative abundance assessed by categorizing as dominant, subdominant, present but common, or present. 2011 2013 chlorophyll-a & nitrate+nitrite-N values for the East Passage site. WHAT’S NEXT Field methods: • a SeaBird SBE 25 Sealogger CTD profiler used to profile water column • a 12-bottle Niskin rosette used to collect discrete depth samples • Li-COR LI-190-SA-50 and LI-193-SA-50 used for PAR analysis, and • In situ monitoring systems comprised of YSI 6600 EDS V2 multi-parameter sondes connected to a remote data acquisition system. • Complete trend and correlation statistical analyses for entire subtidal dataset. We were hoping to have this done by now, but the saying “confidence is the feeling you have before you really understand the problem” is appropriate. • Expand sampling program to semi-monthly at all sites, funding dependent. • Use recent (2013-present) quantitative phytoplankton data to assist with nutrient and chlorophyll data interpretation. 2012 ACKNOWLEDGEMENTS • King County Environmental Laboratory Field Science Unit (sample collection) & Conventionals Unit (sample analyses) • Wendy Eash-Loucks (QC of Seattle Aquarium mooring data)