Download
1 / 17
170 likes | 460 Vues
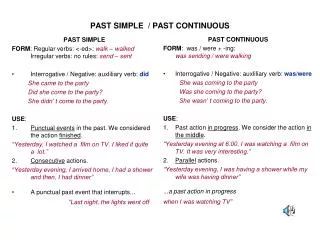
Past performance. SCU Finance Department research seminar, 10/23/2007. Top ability quartile. Top performance quartile. Little overlap = largely luck. Top ability quartile. Top performance quartile. Significant overlap = largely skill. Performance persistence captures “luck versus skill”.

E N D
Past performance SCU Finance Department research seminar, 10/23/2007
Top ability quartile Top performance quartile Little overlap = largely luck
Top ability quartile Top performance quartile Significant overlap = largely skill
Performance persistence captures “luck versus skill” Manager ability Past performance Future performance If ability consistently determines performance, past performance will correlate with future performance
Weak persistence example If 40% of the exceptional managers earn good returns • 28% of the funds with good returns continue to earn good returns • 76% of the mediocre performing funds remain mediocre • 64% of the funds repeat their performance 16 exceptional Top quartile returns 40 12 ordinary 60 24 exceptional 60 48 Lower quartile returns ordinary 240
Strong persistence example If 90% of the exceptional managers earn good returns • 81% of the funds with good returns continue to earn good returns • 94% of the mediocre performing funds remain mediocre • 90% of the funds repeat their performance 81 Top quartile returns exceptional 90 <1 ordinary 10 9 exceptional 10 10 Lower quartilereturns ordinary 290
How investors use persistence in Private Equity • Focus on performance persistence among “good” (top quartile) managers • Studies in private equity suggest 35-45% top quartile persistence in PE • Kaplan and Schoar (2005) • Conner (2005) • Rouvinez (2006)
Future distribution Top quartile 40% Current top quartile 30% 2nd quartile 20% 3d quartile 10% 4th quartile
Superior distribution = superior returns Based on PEI vintage IRRs, 1989-2000: Equally-weighted average return = 18.0% (25% in each quartile) Top quartile-weighted average return = 27.2% (40-30-20-10)
Future distribution Complicated in practice Top quartile 30% Actual top quartile 50% 28% Top quartile after four years 2nd quartile 23% 3d quartile 50% Fall out of top quartile 19% 4th quartile Weighted-average return = 21.4%
Model of luck versus skill • 4N funds managed by 4N managers • N exceptional managers and top quartile funds • Probability x that an exceptional manger is in the top return quartile • Probability FP that Fund t+1 is in the top return quartile, conditional on Fund t being in the top return quartile • FP is observable, x is not.
x determines FP • Expected number of current top return quartile managers that are exceptional = xN • Expected number of current top return quartile managers that are ordinary = (1-x)N • Probability that an ordinary manager is in the top return quartile = [(1-x)N]/3N = (1-x)/3 • FP = [x2N + (1-x)2N/3]/N = x2 + (1-x)2/3 • If x=1 (all skill), perfect persistence (FP=1) • If x=0.25 (all luck), no persistence (FP=0.25)
Infer x from FP x = [1 + (1 – 4(1-3FP))½ ]/4
Incomplete information • Given FP = 0.4, the probability that a top quartile fund has an exceptional manger is 58.5% • If the fund is immature, the probability is likely much lower
Multiple funds (3-yr investment cycle) A series of top quartile funds increases the probability that the manager is exceptional (FP = 0.4)
Dynamic managerial ability Exceptional managers become ordinary with probability p: FP = (N*[x2(1-p)+x(1-x)(p/3)] + N*[x(1-x)(p/3) + (1/3)(1-x)2(1-p/3)])/N x = [6-8p + [(8p-6)2 – 4(12-16p)(3-p-9FP)]½ ]/[2(12-16p)]
Conclusion • Past performance is a useful signal for making investment decisions • Seasoned performance is a stronger signal • A series of top quartile funds is a much stronger signal • Requiring a series of top quartile funds creates two problems • Access to funds may be limited • Opportunity set shrinks rapidly Example: 1000 funds, 40% persistence