Download
1 / 8
140 likes | 423 Vues
Frequency Tables and Histograms. Organize and display data Using tallies and a graph similar to a bar graph. Frequency Table. Use intervals – this will be the labels for the x axis About 5 intervals is good, give or take one, do not want too many or too little

E N D
Frequency Tables and Histograms Organize and display data Using tallies and a graph similar to a bar graph
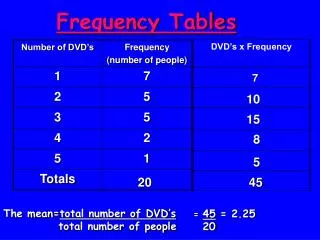
Frequency Table • Use intervals – this will be the labels for the x axis • About 5 intervals is good, give or take one, do not want too many or too little • Find the range – use range to determine how many intervals • Divide by number of intervals, round answer up • Use tallies to count how many times you have data in the interval • Add up the tallies to get the frequency
Histogram • This looks like the frequency table on its side • X-axis should be the intervals, not spaces between them • Y-axis is the frequency • Draw bars for each interval to represent the frequency
Given the data make a frequency table and a histogram 5, 12, 22, 15, 17, 13, 25, 34, 7, 9, 12, 32, 12, 15, 18 Range is 34-5=29 29/ 5=5.8 round up to 6 Dividing by 5 tells us how many numbers to use in each interval The 6 tells us how many intervals we could have
Stem and Leaf Plots A stem-and-leaf plot arranges data by dividing each data value into two parts: a leaf (the last digit), and a stem (the digit or digits other than the last digit). • Stem – the tens place • Leaf – the ones place
Example of Stem and Leaf 55, 82, 90, 113, 100, 90, 93, 68, 66, 108, 116, 56, 85, 89, 102, 103 Step 1: List the stems. The least value is 55, the greatest value is 116. List stems from 5 to 11. Do not omit any stems. Step 2: List the leaves. For each stem, write the ones digit from least to greatest. Step 3: Write a key explaining one value.
Make a Stem and Leaf Plot Make a Frequency table and a Histogram