Download
1 / 25
250 likes | 410 Vues
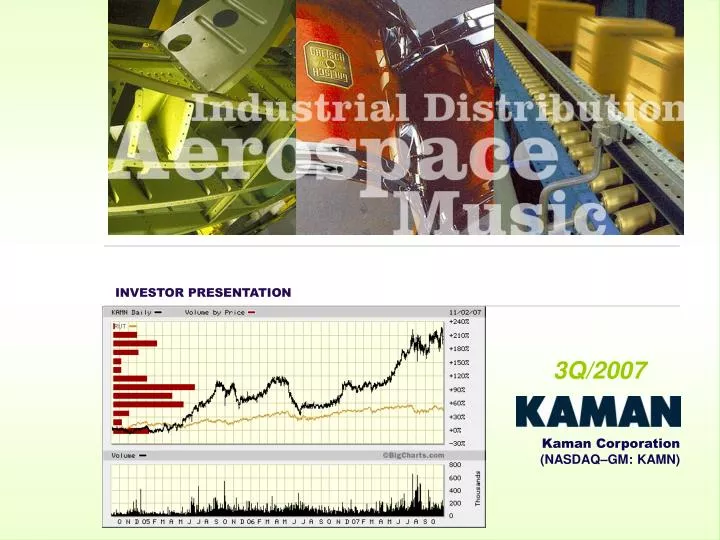
INVESTOR PRESENTATION. 3Q/2007. Kaman Corporation (NASDAQ–GM: KAMN). Forward-looking Statements.

E N D
INVESTOR PRESENTATION 3Q/2007 Kaman Corporation (NASDAQ–GM: KAMN)
Forward-looking Statements This presentation may contain forward-looking information relating to the company's business and prospects, including the Aerospace, Industrial Distribution and Music businesses, operating cash flow, and other matters that involve a number of uncertainties that may cause actual results to differ materially from expectations. Those uncertainties include, but are not limited to: 1) the successful conclusion of competitions for government programs and thereafter contract negotiations with government authorities, both foreign and domestic; 2) political conditions in countries where the company does or intends to do business; 3) standard government contract provisions permitting renegotiation of terms and termination for the convenience of the government; 4) domestic and foreign economic and competitive conditions in markets served by the company, particularly defense, commercial aviation, industrial production and the consumer market for music products; 5) risks associated with successful implementation and ramp up of significant new programs; 6) satisfactory completion of the Australian SH-2G(A) program, including negotiation of payment and performance terms for the balance of the program as well as any additional work scope requested by the Commonwealth; 7) receipt and successful execution of production orders for the JPF U.S. government contract including the exercise of all contract options and receipt of orders from allied militaries, as both have been assumed in connection with goodwill impairment evaluations; 8) the University of Arizona’s continued failure to succeed in its appeals efforts to overturn the jury verdict that rejected the University's breach of contract claim against the company; 9) satisfactory resolution of (i) the company’s contract dispute with the U.S. Army procurement agency relating to the FMU-143 program and (ii) the 2005 DCIS investigation of that program; 10) satisfactory results of negotiations with NAVAIR concerning purchase of the company's leased facility in Bloomfield, Conn.; 11) continued support of the existing K-MAX helicopter fleet, including sale of existing K-MAX spare parts inventory; 12) cost growth in connection with environmental remediation activities at the Moosup facility and such potential activities at the Bloomfield facility; 13) whether and when Kaman's music business is sold on the terms set forth in an agreement entered into as of October 27, 2007; 14) profitable integration of acquired businesses into the company's operations; 15) changes in supplier sales or vendor incentive policies; 16) the effect of price increases or decreases; 17) pension plan assumptions and future contributions; 18) future levels of indebtedness and capital expenditures; 19) continued availability of raw materials in adequate supplies; 20) the effects of currency exchange rates and foreign competition on future operations; 21) changes in laws and regulations, taxes, interest rates, inflation rates, general business conditions and other factors; and 22) other risks and uncertainties set forth in the company's annual, quarterly and current reports, and proxy statements. Any forward-looking information provided in this report should be considered with these factors in mind. The company assumes no obligation to update any forward-looking statements contained in this presentation. Contact: Russell H. Jones, SVP, Chief Investment Officer & Treasurer(860) 243-6307Russell.Jones@kaman.com Slide 1
Kaman Corporation Segment Reporting Structure • Kaman reports information in six business segments: Five of these comprise continuing operations, including • Four aerospace industry segments: • Specialty Bearings • Aerostructures • Helicopters, and • Fuzing • As well as the Industrial Distribution segment. • In addition there is one segment, Music, comprising discontinued operations. Percent Distribution of Segment Sales: Full-year 2006 6% 6% 6% 9% 18% 55% Discontinued Operations Slide 2
EXHIBIT 2 Highlights: Third Quarter Ended September 28, 2007 Four Aerospace industry segments: • Aerostructures segment: Sales up 19.9% driven by Sikorsky BLACK HAWK and other Jacksonville programs; Operating income down 52.8% for quarter due to adjustments related to the simultaneous ramp-up of several new programs at Wichita • Fuzing segment: Sales flat; Operating income up 9.7% for quarter. Segment remains subject to quarter-by-quarter fluctuation. • Helicopters segment: Sales up 18.1% driven by Egypt SH-2G depot level maintenance program and upgrades – and by subcontract work on BLACK HAWK for Sikorsky. Operating income of $2.3 million compared to a loss of $1.1 million in last-year third quarter. Australia Program charge is lower. • Specialty Bearings segment: Sales up 17.5%; Operating income up 55.7% in quarter. Strong demand in a good market. Record backlogs. Industrial Distribution segment: Sales up 6.8%; Operating income up 5.3% for the quarter • Economic conditions mixed for quarter, but appear moderately favorable for second half • Investing in ramp-up of large new national account contracts Slide 3
Aerospace BUSINESS OVERVIEW Four aerospace industry segments 27% 2006 sales for the four segments: $326.0 million Slide 4
Aerospace Sales by aerospace industry segment Millions $ Sales Millions $ Sales Percent Aerospace industry segments: Year ended Quarter ended Military 12/31/0620069/28/079/29/06 • Specialty Bearings $106.3 20% $30.7 $ 26.2 • Aerostructures 78.7 69% 25.7 21.5 • Helicopters 69.9 83% 18.2 15.4 • Fuzing 71.189%22.122.3$326.060%$96.7 $ 85.4 Total these segments Percent share of Kaman’s 2006 aerospace industry sales represented by each of the four aerospace industry segments. Slide 5
Aerospace Specialty Bearings Segment:Bloomfield, CT and Dachsbach, Germany • Designs and manufactures proprietary self-lubricatingbearings for OEM and MRO use in nearly all militaryand commercial aircraft produced in North and South America and Europe. • Strategy: Maintain leadership in product technicalperformance and application engineering supportwhile staying ahead of the curve in producttechnology enhancement: • Target the most demanding applications early in the aircraftdesign process as part of prime-contractors’ problem-solving teams – and, applying innovative technology, developand manufacture proprietary products which effectivelyaddress customers’ needs by providing the highestperformance and service available. • Market size: $0.5 billion high-end portion of the $1.2 billionaerospace bearing market. • Key customers include: Military (U.S. and allied)and Commercial (Boeing, Airbus, Embraer, Bombardier and others). RWG bearings Kamatics airframe bearings and high-performance drive couplings Slide 6
Aerospace Aerostructures Segment: Jacksonville, FL and Wichita, KS • Produces parts and subassemblies for Tier 1 Prime Manufacturers: • Military programs including Boeing C-17internal wing structures, Sikorsky BLACK HAWKhelicopter cockpits, and Sikorsky MH-92 helicopter composite tail rotor pylons. • Commercial programs including Boeing 777subassemblies and 787 composite structures. • Strategy: Take advantage of substantialopportunities arising from the larger producers’(Airbus, Bell, Boeing, Sikorsky,Vought, etc.) offloading of manufacturing. • Seeing opportunity for newprograms: Available capacity, well-located, non-union, flexible, competitive. Top and Middle: Metals-oriented at JacksonvilleBottom: Composites-oriented at Wichita Slide 7
Aerospace Helicopters Segment: Bloomfield, CT • Markets and supports Kaman-made SH-2G Super Seasprite maritime helicopter and K-MAX “Aerial Truck” helicopter – and performssubcontract helicopter programs. • Strategy: Take advantage of increasingopportunities in subcontracting as the Tier 1Prime producers shift from manufacturing tofinal assembly and systems integration. • Principal customers include: The governmentsof Australia, Egypt, New Zealand and Poland;and Sikorsky. • Current principal programs include: SH-2G(A) program for Australia (in a loss position), depot level maintenance and upgrades to SH-2G(E)helicopters for Egypt, and BLACK HAWKsubcontract work for Sikorsky. Top: Kaman SH-2G Super SeaspritesMiddle: Joining BLACK HAWK helicopter sections at Bloomfield facility Bottom: Kaman K-MAX BURRO Slide 8
Aerospace Fuzing Segment: Middletown, CT and Orlando, FL • Manufactures safe, arm and fuzing devicesfor major missile and bomb programs. • Principal Missile programs: AMRAAM, ATACMS, Harpoon, Maverick, Standard and Tactical Tomahawk • Principal Bomb program: Joint Programmable Fuze • Strategy: Become a leading producer of fuzing systems for the U.S. and allied militaries.Market size estimate: $650 million. • Principal customers: U.S. and allied militaries,Boeing, General Dynamics, Lockheed andRaytheon. • Division includes Measuring & MemorySystems products. Fuzes for high profile missile and bomb programs including the Joint Programmable Fuze (JPF); and high performance measuring and memory devices. Slide 9
Industrial Dist BUSINESS OVERVIEW Industrial Distribution segment 55% Slide 10 2006 sales: $665.4 million
Industrial Distribution Industrial Distribution Segment • Third largest player in $12 billion power transmission market. Provides nearly two million products to morethan 50,000 MRO and OEM customers. • Expand the geographic footprint in major industrial marketsto enhance competition for national and regional accounts. • Broaden the product line and further enhance operating and asset utilization efficiencies throughout the enterprise. • Serves a broad cross section of North Americanindustry with local branches in 70 of the top 100 U.S. Industrial markets. Growing national account base. • Now nearly 200 locations in the U.S., Canadaand Mexico. • The business tends to track the U.S. Industrialproduction and capacity utilization indices. Extensive product catalogue Value-added service Slide 11
Industrial Distribution FRB Indices Of Industrial Production and Capacity Utilization:Predictability: Segment tends to track national indices Slide 12 Source: Federal Reserve Board
Industrial Distribution Geographical Coverage:Approximately 200 locations in U.S., Canada and Mexico Slide 13
Music BUSINESS OVERVIEW Discontinued Operations (Music Segment) 18% Slide 14 2006 sales: $214.8 million
Discontinued Operations Discontinued Operations: Music Segment • Largest independent distributor of musicalinstruments and accessories • On October 29, 2007, Kaman announced an agreementto sell 100% of segment to Fender Musical Instruments Corp. for approximately $117 million.Stock transaction. • Closing targeted to occur prior to January 1, 2008subject to favorable Hart-Scott-Rodino antitrustreview and customary conditions. • When closed, transaction expected to resultin an after tax gain of approximately $14 million,or $0.55 per share, fully diluted and generatenet proceeds of approximately $100 million. • Proceeds to be used initially to reduceindebtedness and thereafter to pursue strategicobjectives. Largest independent distributor of percussion and fretted musical instruments and accessories;Industry-leading information technology systems Slide 15
STRATEGIES Financial Review Slide 16
Income Statement Highlights for Continuing and Discontinued Operations For the three-month periods ended 9/29/069/28/07 Sales: 3Q 2007: up 7.9% over 3Q 2006 Earnings before Income Tax:See GAAP reconciliation (Slide 19)for effect of one-time charge inthird quarter 2007 and 2006 Net Earnings:3Q 2007: up 34.3% over 3Q 2006EPS – diluted:Average diluted shares outstanding9/29/06: 24,794; 9/28/07: 25,336 $331.9 $307.6 $19.0 $14.4 $11.7 $8.7 $0.47 $0.36 Slide 17
Income Statement Highlights for Continuing and Discontinued Operations For the first nine-month periods ended 9/29/069/28/07 Sales: 1st 9 Mos 2007: up 8.0% over 1st 9 Mos 2006 Earnings before Income Tax:See GAAP reconciliation (Slide 20)for effect of one-time charge in 1st 9 Mos of 2007 and 2006 Net Earnings:1st 9 Mos 2007: up 43.9% over 1st 9 Mos 2006 EPS – diluted:Average diluted shares outstanding9/29/06: 24,854; 9/28/07: 25,217 $969.2 $897.2 $50.6 $36.6 $31.9 $22.1 $1.28 $0.91 Slide 18
GAAP reconciliation applicable to the Third-Quarter Periods This adjustment represents a discrete item. The Company uses certain financial measures internally to focus management on period-to-period changes in our business. Therefore, we believe that this supplemental information is meaningful to investors when considered in connection with the information contained in the GAAP presentation of financial information. The presentation of this item is not meant to represent results as defined by GAAP, nor as an alternative for financial performance as determined under GAAP. Slide 19
GAAP reconciliation applicable to the First Nine Month Periods This adjustment represents a discrete item. The Company uses certain financial measures internally to focus management on period-to-period changes in our business. Therefore, we believe that this supplemental information is meaningful to investors when considered in connection with the information contained in the GAAP presentation of financial information. The presentation of this item is not meant to represent results as defined by GAAP, nor as an alternative for financial performance as determined under GAAP. Slide 20
Income Statement Highlights for the Third-Quarter Periods 1 Corporate expense percentage is to Total Sales Slide 21
Income Statement Highlights for the First Nine Month Periods 1 Corporate expense percentage is to Total Sales Slide 22
Balance Sheet and Capital Factors Slide 23
KAMN KAMAN CORPORATION Traded on NASDAQ Global Market Public information is available on the Kaman website: www.kaman.com