Download
1 / 38
390 likes | 630 Vues
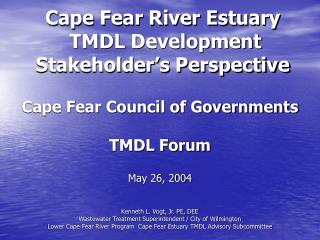
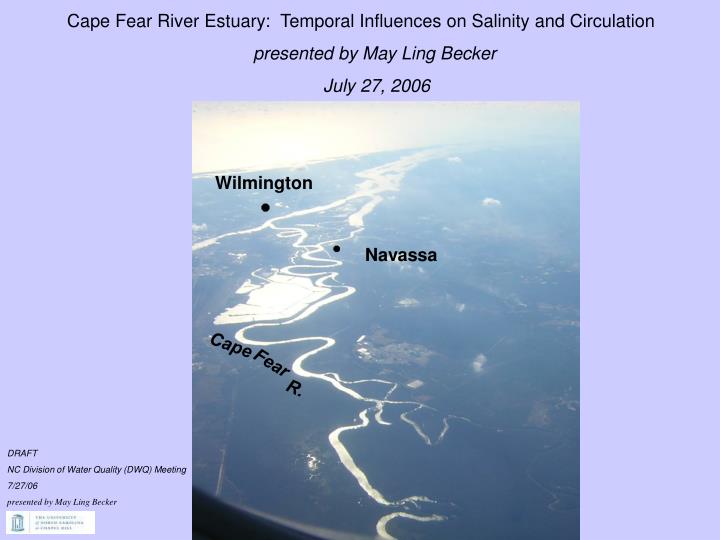
Wilmington. Navassa. Cape. Fear. DRAFT NC Division of Water Quality (DWQ) Meeting 7/27/06 presented by May Ling Becker. Cape Fear River Estuary: Temporal Influences on Salinity and Circulation presented by May Ling Becker July 27, 2006. R.

E N D
Wilmington Navassa Cape Fear DRAFT NC Division of Water Quality (DWQ) Meeting 7/27/06 presented by May Ling Becker Cape Fear River Estuary: Temporal Influences on Salinity and Circulation presented by May Ling Becker July 27, 2006 R.
DRAFT NC Division of Water Quality (DWQ) Meeting 7/27/06 presented by May Ling Becker Outline • Research synopsis • River influences on salinity intrusion • Tidal influences on salinity stratification • Field study analysis of tidal influences (low flow) • Description of data collection • Findings
DRAFT NC Division of Water Quality (DWQ) Meeting 7/27/06 presented by May Ling Becker Cape Fear Black River River Northeast S9.0 Cape Fear S9.9/10.0 NCF117 USGS Stream-flow Gauges River NCF6 DP NC11 HB Wilmington Tide Gauge Lock and Dam 1 AC S7.9/8.0 IC S11.0 Navassa (S6.9/7.0) USACOE Tide Gauges N Wilmington S5.9/6.0 M61 M54 M42 USACOE Velocity Meters S3.9/4.0 M35 LCFRP Sampling Stations 25 km M23 Southport WilmingtonWind Gauge S2.0 M18 Fort Caswell (S1.2/1.3)
DRAFT NC Division of Water Quality (DWQ) Meeting 7/27/06 presented by May Ling Becker Purpose Goal: To develop an increased understanding of estuarine hydrodynamics including temporally varying mechanisms that impact changes in stratification, mixing, and circulation • Influence of river inflow on salinity intrusion • Effect of tidal variations on changes in stratification with time including ebb-flood and tidal-range differences
DRAFT NC Division of Water Quality (DWQ) Meeting 7/27/06 presented by May Ling Becker River Environment for 1999-2003 Study Period
DRAFT NC Division of Water Quality (DWQ) Meeting 7/27/06 presented by May Ling Becker River Influences: Salinity Intrusion A) January 7, 1999 Upstream NAV M18 B) July 15, 1999 M18 NAV
Salinity Intrusion Discharge Relationships DRAFT NC Division of Water Quality (DWQ) Meeting 7/27/06 presented by May Ling Becker Y = 54.622 e-0.0005Qp R2 = 0.92 Qp=Max[Q(to-1):Q(to-11)] where to = day of salinity intrusion sampling, Q = mean daily discharge
DRAFT NC Division of Water Quality (DWQ) Meeting 7/27/06 presented by May Ling Becker Tidal Influences and Stratification: Tidal RangeVariations S 6.9 8 m/s tau ~ 10-2
DRAFT NC Division of Water Quality (DWQ) Meeting 7/27/06 presented by May Ling Becker Tidal Influences and Stratification: Intra-tidal Variations S 3.9 and S 4.0
DRAFT NC Division of Water Quality (DWQ) Meeting 7/27/06 presented by May Ling Becker Research Summary of Historical Observational Data The salinity and circulation structure are impacted by: 1) Sub-tidal scale variations in freshwater input which influence the location of the salinity intrusion. 2) Tidal range differences based on an approximately 29-day periodicity 3) Intra-tidal variations associated with tidal straining
DRAFT NC Division of Water Quality (DWQ) Meeting 7/27/06 presented by May Ling Becker Research Summary of Historical Observational Data 1. A correlation between peak in river discharge (hydrologic flood) and the salinityintrusion location is observable. 2. Differences in stratification occur during the flood-ebb and 29-day tidal range cycles. Analysis suggests these differences impactcirculation (velocities).
DRAFT NC Division of Water Quality (DWQ) Meeting 7/27/06 presented by May Ling Becker Scientific Questions: Tidal and Hydrologic Influences • How does the estuary salinity intrusion respond to flood- • versus base-flow conditions? How may the previous discharge • history influence the location of the salinity intrusion? 2. How does stratification vary with tidal-range (29-day periodicity) and ebb- versus flood-tide conditions? • Proposed data collection for stratified section of estuary: • Change in stratificationw.r.t time • Along-channel and vertical velocities • Differences in salinity • (in the vertical and horizontal)
DRAFT NC Division of Water Quality (DWQ) Meeting 7/27/06 presented by May Ling Becker Field Study: Velocity, Salinity and Elevation Measurements • ADCP velocity transects • M42 to M46: mid-estuary • ~ 3 km per transect • ~ 14 hours: flood, ebb, slack • 1-m increments • July 12, 2005 (Apogee) • July 26, 2005 (Perigee) • CTD salinity sampling • Minimum of three stations • M42, M44, and M46 along transect • 1-m increments • July 12, 2005 • July 26, 2005 (DWQ)
DRAFT NC Division of Water Quality (DWQ) Meeting 7/27/06 presented by May Ling Becker Field Study: Velocity, Salinity and Elevation Measurements • Tidal elevations • S 4.0 near mid-estuary • June 28-August 8, 2005 Coordinated salinity sampling with DWQ at stations M42, M44, and M46 on July 26, 2005
River NAVASSA Wilmington Salinity Stations M46 M42 Tide Gauge S4.0 N Southport DRAFT NC Division of Water Quality (DWQ) Meeting 7/27/06 presented by May Ling Becker Summer 2005 Study Area Cape Fear M44
65 m3sec-1 51 m3sec-1 DRAFT NC Division of Water Quality (DWQ) Meeting 7/27/06 presented by May Ling Becker River and Wind Environment Summer 2005 Study Period 7/12/05 Average daily wind speed: 2.9 m/s generally from S or SW (from 8 am to 11 pm) Maximum daily wind speed: 6.2 m/s 7/26/05 Average daily wind speed: 2.1 m/s generally from N, NW, calm or var. (from 9 am to 11 pm) Maximum daily wind speed: 3.6 m/s
29 days 29 days S S S July 26: HIGH July 12: LOW DRAFT NC Division of Water Quality (DWQ) Meeting 7/27/06 presented by May Ling Becker Tidal Environment for Summer 2005 Study Period Wilmington Measured Tides S4.0 Measured Tides June 28-Aug. 7, 2005
DRAFT NC Division of Water Quality (DWQ) Meeting 7/27/06 presented by May Ling Becker Along-channel Velocities Sampling Tidal Range ~ 1.0 m Sampling Tidal Range ~ 1.4 m
DRAFT NC Division of Water Quality (DWQ) Meeting 7/27/06 presented by May Ling Becker Apogee Transect Average (7/12/05)
DRAFT NC Division of Water Quality (DWQ) Meeting 7/27/06 presented by May Ling Becker Perigee Transect Average (7/26/05)
DRAFT NC Division of Water Quality (DWQ) Meeting 7/27/06 presented by May Ling Becker Stratification
DRAFT NC Division of Water Quality (DWQ) Meeting 7/27/06 presented by May Ling Becker Scientific Questions • What determines differences in patterns of stratificationobserved during the flood vs. ebb tide and high vs. • low tidal ranges? 2. How does up-estuary transport differ? How may in (1) be related to (impact) up-estuary transport? 3. What differences are observed in the density, shear, and mixing characteristics? How do these differences influence the evolution of the bottom boundary layer (BBL)? 4. How well can observed differences be explained by classical estuarine analysis (analytical solutions, physical scaling)?
0.1 0.05 DRAFT NC Division of Water Quality (DWQ) Meeting 7/27/06 presented by May Ling Becker Stratification Frequency N 2 = N = Stratification Frequency
DRAFT NC Division of Water Quality (DWQ) Meeting 7/27/06 presented by May Ling Becker M44 Density Distribution (7/12/05) Kg m-3 Depth (m) Transect No.
DRAFT NC Division of Water Quality (DWQ) Meeting 7/27/06 presented by May Ling Becker M44 Density Distribution (7/26/05) Depth (m) Kg m-3 Transect No.
19 19 ~“saltiest” apogee profile 19 19 19 19 DRAFT NC Division of Water Quality (DWQ) Meeting 7/27/06 presented by May Ling Becker Transect 12 Near slack Transect 1 Near slack Transect 6 Weaker Flood Transect 10 Strong Ebb Transect 11 Weaker Ebb Transect 4 Strong Flood M46 M42 Vertical Salinity Sections (7/12/05) Depth below surface (m)
DRAFT NC Division of Water Quality (DWQ) Meeting 7/27/06 presented by May Ling Becker M46 M42 Vertical Salinity Sections (7/26/05) 17 ~“saltiest” perigee profile 17 Depth below surface (m) 17 17 17 17 Transect 1 Start of Flood Transect 8 Weaker Flood Transect 16 Strong Ebb Transect 4 Strong Flood Transect 17 Weaker Ebb Transect 18 Near slack
M44 Density Stratification Structure and Bottom Salinity: 7/12/05 DRAFT NC Division of Water Quality (DWQ) Meeting 7/27/06 presented by May Ling Becker F = Flood Kg m-4 E = Ebb F (“constrained mixed”) S = Slack F (“convective”) S E E
M44 Density Stratification Structure and Bottom Salinity: 7/26/05 DRAFT NC Division of Water Quality (DWQ) Meeting 7/27/06 presented by May Ling Becker F = Flood Kg m-4 E = Ebb S = Slack F (“partially constrained mixed”) E F (“convective”) E S
Transect Average Shear Structure: 7/12/05 and 7/26/05 DRAFT NC Division of Water Quality (DWQ) Meeting 7/27/06 presented by May Ling Becker Strong “internally produced” shear on max. and falling ebb tide s-1 Strengthening of ebb near surface “internally produced” shear on rising and near max. flood tide
u* = friction velocity (“scale of turbulent velocity fluctuations”) β= saline expansivity DRAFT NC Division of Water Quality (DWQ) Meeting 7/27/06 presented by May Ling Becker Horizontal Richardson Number • Defines “threshold condition” for onset of stratification • (Stacey et al., 2001, Stacey and Ralston, 2005, Simpson et al, • 2005) • Assumes advection and vertical turbulent diffusion • balance to determine degree of stratification • (evolution of stratification equation) Defined by: H = depth, g = gravitational acceleration, Γ ~ Rix > threshold value (order 1) water column stratifies Rix < threshold value tidal mixing sufficient to break down stratification
Parameterize u*2 = Cd U2 where U is boundary layer averaged • mean velocity (Stacey and Ralston, 2005) where u* = friction velocity = (τo / ρ)1/2 where τo= bed stress where β= saline expansivity, CFRE Low Flow Horizontal Richardson Number Goal: To explain the onset of prolonged stratification in the CFRE (during apogee) Means: Compare Rix during 1) perigee flood, ebb and 2) apogee flood, ebb • B) Determine the height of the bottom boundary layer (BBL) • (Stacey and Ralston, 2005) • Corresponds to height of maximum tidal velocity on flood • Determined by interaction of stratification and shear on ebb • C) Calculate: H = depth, u*= friction velocity, g = gravitational acceleration, Γ ~ from field data DRAFT NC Division of Water Quality (DWQ) Meeting 7/27/06 presented by May Ling Becker
DRAFT NC Division of Water Quality (DWQ) Meeting 7/27/06 presented by May Ling Becker CFRE Low Flow Horizontal Richardson Number
Stratification maintained water column stratifies Rix > ~1 DRAFT NC Division of Water Quality (DWQ) Meeting 7/27/06 presented by May Ling Becker Stratification For max. flood, ebb and For Cd= 0.001 water column stratified Stratification maintained
Salinity Structure 7/12/05 DRAFT NC Division of Water Quality (DWQ) Meeting 7/27/06 presented by May Ling Becker Flood-tide Near-bottom salinity: 18.0 to 21.0 ppt Ebb-Slack tide Near-bottom salinity: 20.9 to 19.2 ppt
Salinity structure 7/26/05 DRAFT NC Division of Water Quality (DWQ) Meeting 7/27/06 presented by May Ling Becker Flood-tide Near-bottom salinity: 16.6 to 21.4 ppt Ebb-Slack tide Near-bottom salinity: 21.3 ppt to 16.4
DRAFT NC Division of Water Quality (DWQ) Meeting 7/27/06 presented by May Ling Becker Low Flow Findings: Summer Field Study The low-flow salinity and circulation structure is impacted by: 1) tidal range differences based on an approximately 29-day periodicity and 2) intra-tidal variations associated with tidal straining 1. Analysis of field data (summer 2005) supports the hypothesis that salinity, circulation and transport characteristics are critically linked to ebb-flood and tidal-range variability. During periods of reduced friction (e.g. apogee), stratification is high (approaches state of more “permanent stratification”) and up-estuary salt transport increases. 2. Analysis suggests the vertical differences (e.g. in stratification, shear) influence the evolution of the bottom boundary layer. Observations suggest the “salty bottom water” is generally constrained to a bottom boundary layer capped by a sharp density gradient during the low tidal range conditions (but are able to reach near-surface levels during higher tidal range, e.g perigee). 3. Initial computations suggest differences in stratification patterns may be parameterized based on the relative strength of stabilizing vs. destabilizing influences (e.g. Rix).
DRAFT NC Division of Water Quality (DWQ) Meeting 7/27/06 presented by May Ling Becker References Chatwin, P.C., 1976, “Some Remarks on the Maintenance of the Salinity Distribution in Estuaries,” Estuarine and Coastal Marine Science, 4, p. 555-566. Hetland, R.D., Geyer, W.R.,2004, “An Idealized study of the Structure of Long, Partially Mixed Estuaries,” Journal of Physical Oceanography, 34, p. 2677-2691. MacCready, P., 2004, “Toward a Unified Theory of Tidally-Averaged Estuarine Salinity Structure,” Estuaries, 27, (4), p. 561-570. Monismith, S.G., Kimmerer, W., Burau, J.R., and Stacey, M.T., 2002, “Structure and Flow-induced Variability of the Subtidal Salinity Field in Northern San Francisco Bay,” Journal of Physical Oceanography, 32, p. 3003-3019. Simpson, J.H., Williams, E., Brasseur, L.H., Brubaker, J.M., 2005, “The Impact of tidal straining on the cycle of turbulence in a partially stratified estuary,” Continental Shelf Research, 25, p. 51-65. Stacey, M.T., Burau J.R., Monismith, S.G., 2001, “Creation of Residual flows in a partially stratified estuary,” Journal of Geophysical Research, Vol. 106, No. C8, p. 17013-17037. Stacey, M.T. and Ralston, D.K., 2005, “The Scaling and Structure of the Estuarine Boundary Layer,” Journal of Physical Oceanography, 35, p. 55-71.