Download
1 / 6
60 likes | 159 Vues
41a . Distribution of fatalities in construction, by age group, in 1992, 2005, and 2010 (All employment). 41b . Distribution of nonfatal injuries resulting in days away from work in construction , by age group, in 1992, 2005, and 2010 (Private wage-and-salary workers).

E N D
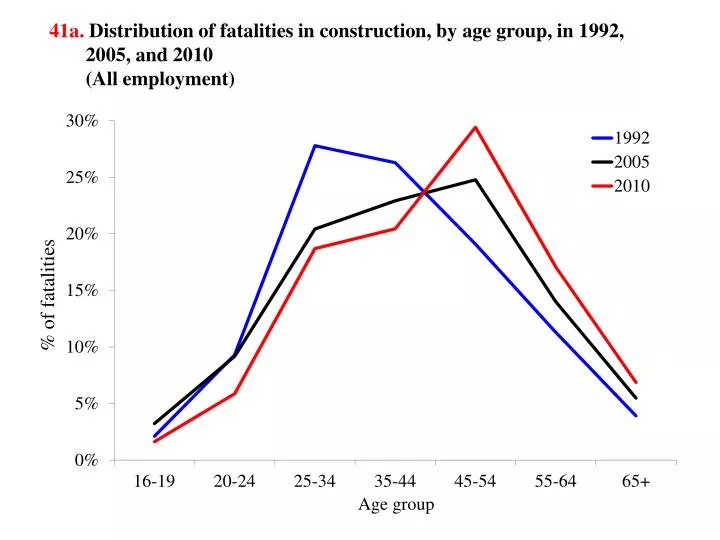
41a.Distribution of fatalities in construction, by age group, in 1992, 2005, and 2010(All employment)
41b.Distribution of nonfatal injuries resulting in days away from work inconstruction, by age group, in 1992, 2005, and 2010(Private wage-and-salary workers)
41c. Rate of fatal and nonfatal injuries in construction, by age group, 2008-2010 average Fatality data cover all employment. Nonfatal injury data cover private wage-and-salary workers.
41d. Median days away from work by age group, construction vs. all industries, 2010(Private wage-and-salary workers)
41e. Rate of fatalities in construction, by Hispanic ethnicity, three time periods from 1992-2010(All employment)
41f. Rate of nonfatal injuries in construction, by Hispanic ethnicity, three time periods from 1992-2010(Private wage-and-salary workers)