Download
1 / 10
100 likes | 370 Vues
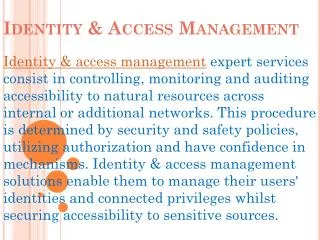
Identity & Access Management Total Cost of ownership Study. Research by independent consultancy Rencana. Goal: Compare Total Cost of Ownership for IAM Products. Which IAM products have the lowest total cost of ownership (TCO)? Key questions required to compare IAM TCO across products:

E N D
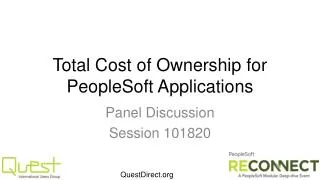
Identity & Access Management Total Cost of ownership Study Research by independent consultancy Rencana
Goal: Compare Total Cost of Ownership for IAM Products Which IAM products have the lowest total cost of ownership (TCO)? Key questions required to compare IAM TCO across products: • Do differences in licensing and maintenance expenses impact TCO? • Do differences in product integration and configuration service expenses impact TCO? • Do differences in operations and support expenses impact TCO?
Research Methodology • Conducted primary research via a survey and one-on-one interviews to gather data to answer our key questions • Consulted nearly 50 IAM customers and systems integrators: • Customers and systems integrators in the United States and Europe • Customers in each of the medium (2,500+ users), large (7,500+ users), and massive (40,000+ users) business classifications, and the systems integrators that service these organizations • Gathered quantitative and qualitative data to evaluate the total cost of ownership of Provisioning and Web Access Management products from Novell, Oracle, CA, IBM, and Courion° • Analyzed differences in licensing, configuration, and operations costs between competitive products • Eliminated data points that demonstrated no significant difference in cost between any of the products (e.g., electricity usage, hosting) • Converted Euros (€) to 1.30 USD ($) when appropriate ° Courion did not have a web access management product at the time of the study
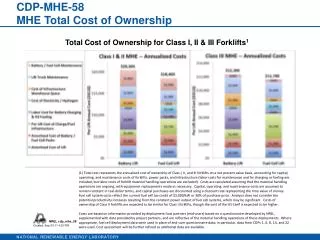
Major IAM Software TCO Comparison Novell Identity Manager and Access Manager products have a lower total cost of ownership (TCO) than competitive products because they are easier to configure, integrate, and administer. 24% more than Novell Novell Competitive Set Average (Oracle, CA, IBM, Courion) 25% more than Novell Novell Competitive Set Average (Oracle, CA, IBM, Courion) 23% more than Novell Novell Competitive Set Average (Oracle, CA, IBM, Courion) All Figures Based on5 Year Present Value
Components of IAM TCO for Massive Enterprises Over five years, differences in total cost of ownership are driven by services and operations expenses (not licensing and maintenance): Novell TCO 24% < Competitive Set Novell Average % more (less) than Novell 19% 104% (1%) 69% 3% 54% 457% Oracle Average % more (less) than Novell 39% 170% 14% 56% 6% (30%) 458% Competitive Set Average (Oracle, CA, IBM, Courion) All Figures Based on5 Year Present Value
Impact of $0 IAM Software License Fees for Massive Enterprises If licensing for competitors was $0 (but Novell license was average fee), Novell TCO remains less, after 5 years: Excess TCO Novell License Fee Novell with License Fees 4% Average % more (less) than Novell 19% 69% 54% 3% 104% (9%) (100%) 457% Oracle without License Fees Oracle Average % more (less) than Novell 6% 56% 39% 458% (30%) 170% 6% (100%) Competitive Set Average without License Fees (Oracle, CA, IBM, Courion) All Figures Based on5 Year Present Value
Ongoing Integration: Add 30 More Provisioning Targets The cost to add additional connectors to an existing provisioning deployment is disproportionate between vendors: Cost Savings per 30 Applications ~ $17,500 per connector ~ $21,000 per connector Novell 46% <- (Hundreds of Thousands of $) -> Average % more (less) than Novell ~ $26,650 per connector ~ $28,450 pre connector Oracle Average % more (less) than Novell ~ $27,100 per connector ~ $ 29,300 per connector Competitive Set Average (Oracle, CA, IBM, Courion) All Figures Based on5 Year Present Value
Answers to Key Questions • Do differences in licensing and maintenance expenses impact TCO? Yes, but these costs are not as significant to the total cost of ownership as other components. For large deployments (more than 30 applications) initial costs such as licensing become irrelevant in determining the lowest TCO. • Do differences in product integration and configuration services impact TCO? Yes. Systems integrators tell us they regularly quote 20% less for Novell IAM implementations than for competitive products. Our analysis demonstrates this has a compounding effect when considered across multiple integration phases and can have a very significant impact on TCO. Services are generally the primary driver of TCO. • Do differences in operations and support expenses impact TCO? Yes. The differences in the cost of operations and support can be significant on a percentage basis. However, services expenses typically outpace those of operations, even over five years (present value). While these expenses drive relative TCO differences, customers tell us that real cost savings are garnered when their operations teams are able to continue integrating new applications into their IAM technology framework well after the consultants have left, which enables the organization to realize the benefits of their IAM investment across a larger base.
Additional Novell TCO Difference Drivers • Novell out-of-the-box provisioning connectors require up to 75% less systems integrator time to deploy than competitive products. • Novell custom provisioning connectors require up to 30% less systems integrator time to deploy than competitive products. • Novell averages 20%+ less systems integration fees for a comparable provisioning project at companies of all sizes. • Novell IAM products require an average of 81% less time to generate required audit reports. • Novell IAM products experience an average of 55% less downtime. • Novell IAM products can be maintained by a team of business analysts rather than a team of developers (little direct cost savings, but big qualitative difference). All Figures Based on5 Year Present Value
Recommendations • Total cost of ownership can vary significantly between leading IAM product vendors. Choose wisely and think like a CFO. • Ease of integration is the most significant factor in differentiating TCO between product vendors and is realized initially via your consultants and ongoing via your team’s ability to continue integrating a large portion of your organization’s critical applications; choose a product that you and your consultants can figure out how to deploy. • Focus less on licensing and maintenance costs and more on services and operations costs. • The present value of five years’ product maintenance and operations are, on average, significantly greater than initial license expenses; don’t be lured into switching products based on an offer of a lower license expense.