Download
1 / 24
370 likes | 905 Vues
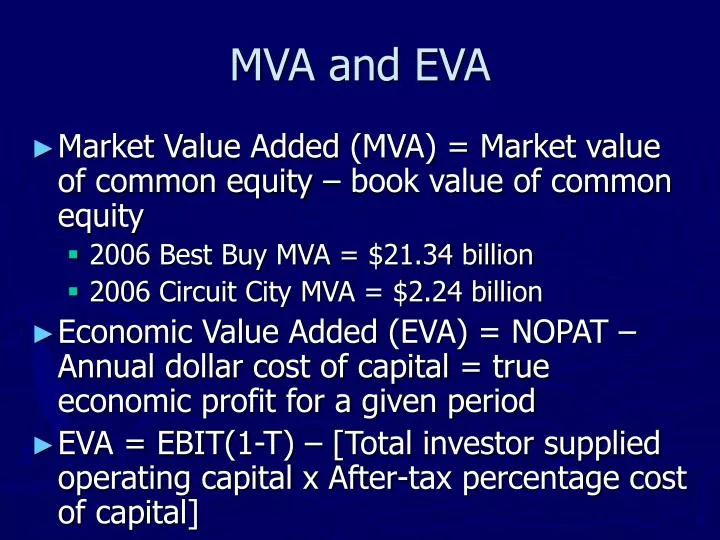
MVA and EVA. Market Value Added (MVA) = Market value of common equity – book value of common equity 2006 Best Buy MVA = $21.34 billion 2006 Circuit City MVA = $2.24 billion Economic Value Added (EVA) = NOPAT – Annual dollar cost of capital = true economic profit for a given period

E N D
MVA and EVA • Market Value Added (MVA) = Market value of common equity – book value of common equity • 2006 Best Buy MVA = $21.34 billion • 2006 Circuit City MVA = $2.24 billion • Economic Value Added (EVA) = NOPAT – Annual dollar cost of capital = true economic profit for a given period • EVA = EBIT(1-T) – [Total investor supplied operating capital x After-tax percentage cost of capital]
Chapter 16 Financial Planning and Forecasting
Financial Forecasting Steps • Forecast Sales • Project the Assets Needed to Support Sales • Project Internally Generated Funds • Project Outside Funds Needed • Decide How to Raise Funds • See Effects of Plan on Ratios
Our Problem: Zippy Drives, Inc. • 2006 Sales 10,000,000 • 2006 Total Assets 8,000,000 • Want to project 2007 financial statements based on a 30% increase in sales. • Projected 2007 Sales 10,000,000(1.30) = $13,000,000
AFN formula Key Assumptions: Known as percentage of sales approach. • Zippy is operating at full capacity in 2006. • Each type of asset grows proportionally with sales. • Accounts payable and accruals grow proportionally with sales. • 2006 profit margin (15%) and payout (30%) will be maintained. • Sales are expected to increase by $3 million. (%S = 30%)
Oh no! Here come the Accounting Police! Projected 2007 Assets 10,400 Projected 2007 Liab&Eq 9,815 External Financing Needed 585 • Assume Zippy will raise 40% of external financing needed through Notes Payble and the rest (60%) through Long-term Debt. • Addition to Notes Payable 234 • Addition to Long-term Debt 351
AFN equation: When you just need to know additional financing needed. AFN = (A*/S)S - (L*/S)S - M(S1) (RR) RR = retention ratio = 1 – dividend payout AFN = ($8,000 / $10,000) ($3,000) - ($1,500 / $10,000) ($3,000) - 0.15($13,000) (1- 0.3) = $585.
Key Determinants of External Funds Requirements (AFN) • Sales growth: higher growth leads to more AFN • Capital Intensity Ratio (A/S): higher A/S leads to more AFN • Spontaneous liabilities to sales ratio (L/S): higher ratio means more internal financing and less AFN • Profit Margin (M): higher profit margin means higher net income and less AFN • Retention Ratio: higher ratio means more retained earnings and less AFN
Forecasting with less than Full Capacity • Assume Zippy’s net fixed assets were operating at 80% capacity and current assets at 100% capacity in 1997. • How would Zippy’s additional financing needed change? • Need to know what level of sales Zippy’s existing net fixed assets can support or produce = Full Capacity Sales
Zippy’s Full Capacity Sales and projected new fixed assets • Full Capacity Sales (FCS) = Current Sales/% of Capacity • Zippy’s 2006 Sales = 10,000 • 80% Capacity • Full Capacity Sales = 10,000/0.8 = 12,500 • Target FA Ratio = 2006 FA/ FCS • 4000/12,500 = 0.32 = 32% • Proj FA = 0.32(proj sales) = 0.32(13,000) = 4,160
New AFN is -455 • This means Zippy can reduce debt to make the projected balance sheet balance or just add the surplus financing to the cash account.
Caveats • We have assumed a constant profit margin which means interest expense is assumed to increase proportionally with sales. • A company’s financing decision may cause the actual interest expense to be higher or lower than this projection. • If the additional financing decision causes interest expense to be higher, then even more financing will be needed.
Other Financial Forecasting Approaches • Instead of assuming individual assets will remain a constant percentage of sales, a company can modify their forecast by: • using regression analysis to project individual asset accounts. • using target financial ratios to project individual asset accounts.
Financial ForecastingSummary • Unless stated otherwise, all expenses are assumed to increase proportionally with sales, yielding the same profit margin • At full capacity, all assets increase proportionally with sales • Only accounts payable and accrued taxes and wages(accruals) increase proportionally with sales • Forecasted Retained Earnings are added to the previous year’s b/s acct. 1
Chapter 16 Summary (cont.) • With financial statement forecast, AFN = projected total assets - projected liab&eq • Proj. spontaneous assets and liabilities = last year’s ratio of each account to sales times forecasted sales • AFN is plug amount that makes the balance sheet balance • With AFN equation, AFN = projected change in assets - proj. change in liabilities - projected new retained earnings 2
End of Chapter 16 Summary • If fixed assets are operating at less than 100% capacity, determine full capacity sales • Full capacity sales = old sales/ % of capacity • If projected sales < full capacity sales, no increase in fixed assets is needed • If projected sales > full capacity sales, then proj. FA = old FA/Full capacity sales times projected sales 3