Download
1 / 35
350 likes | 471 Vues
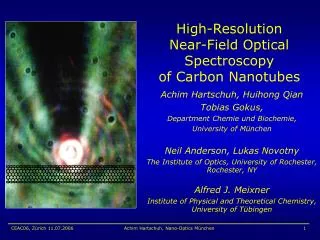
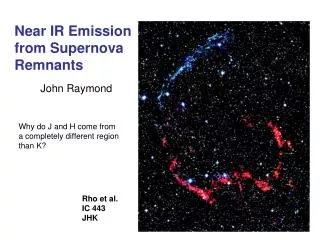
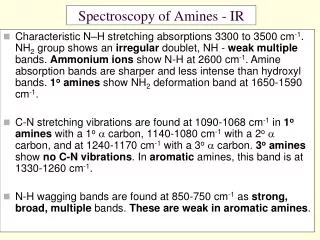
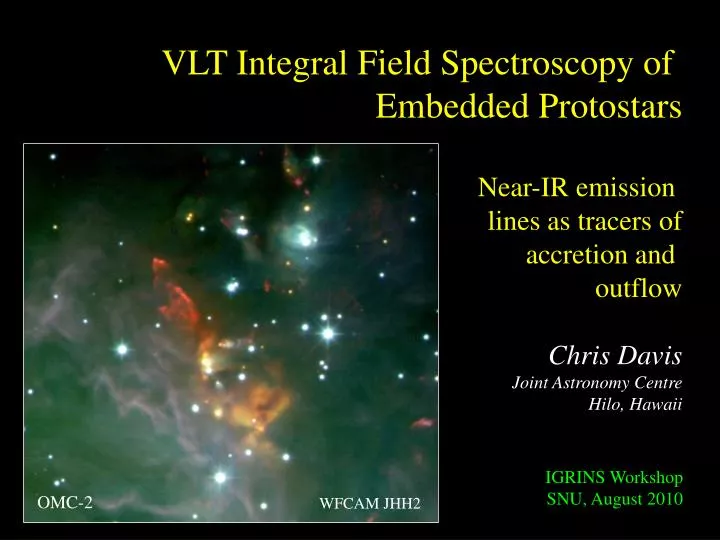
VLT Integral Field Spectroscopy of Embedded Protostars Near-IR emission lines as tracers of accretion and outflow Chris Davis Joint Astronomy Centre Hilo, Hawaii. IGRINS Workshop SNU, August 2010. OMC-2. WFCAM JHH2. HST/NICMOS. SVS13.

E N D
VLT Integral Field Spectroscopy of Embedded Protostars Near-IR emission lines as tracers of accretion and outflow Chris Davis Joint Astronomy Centre Hilo, Hawaii IGRINS Workshop SNU, August 2010 OMC-2 WFCAM JHH2
HST/NICMOS SVS13 Why do spectroscopy of protostellar jet sources…? 2.12/3.6/4.5m Davis et al. 2008 Reipurth et al. 2000
HH sources Early spectroscopic observations of embedded young stars - particularly (variable) outflow sources - reveal a wealth of emission lines…. FUors Reipurth & Aspin, 1997
At about the same time… High-spectral-resolution observations of T Tauri stars Spatial & kinematic properties… Continuum-subtracted Spectral Images Hirth et. al, 1997
Echelle spectroscopy at UKIRT with CGS4 R ~ 16,000; H2 1-0S(1) @ 2.122 m Davis et al. 2001
Spatial information from Spectro-Astrometry • Fit Gausian • Measure position of • peak to within • Hundredths • of an arcscond • (10s of AU scales) - position - - velocity - Profile along slit in one velocity bin (along one column)
45 AU 60 AU 60 AU 1500 AU
Echelle spectroscopy at UKIRT with CGS4 Davis et al 2003
Echelle spectroscopy at UKIRT with CGS4 Davis et al 2003 Aha! A fast [FeII] jet with a slow H2 wind - a result!!.
Benefits of Integral Field Spectroscopy 2-Dimensional spectroscopy (3-D data cube) Simultaneous imaging in multiple lines Images taken with same weather conditions (seeing and cloud) All images aligned on the sky (differential refraction found to be minimal) Perfect “continuum-subtraction” possible - ideal for bright jet sources!!
Observed SEVEN HH energy sources SINFONI on the ESO-VLT 1.1-2.45 m Integral Field Spectrometer 2048x2048 Hawaii 2RG array 32 slitlets, each is 64 pixels long and 2 pixels wide 0.05 arcsec pixels; 3.2 x 3.2 arcsec field of view H+K grating used (R~1500; v ~ 200 km/s)
HH 999-IRS HH 34-IRS HH 300-IRS Red - Br, Green - H2, Blue - [FeII], Contours - continuum SVS 13 HH 26-IRS HH 72-IRS
red Stepping through wavelength (velocity) ( R ~ 1500, V ~ 200 km/s) …can see red and blue lobes, but not much else in these channel maps blue • Not continuum-subtracted • Each channel separated • by ~200 km/s (two pixels)
HH 34-IRS in [FeII] 1” Insufficient velocity resolution! though clearly there’s important kinematic information that we are just missing… Acceleration along jet? Gradient across width of flow? IGRINS!? Each channel separated by ~100 km/s (one pixel)
Br [FeII] H2 70AU (0.32”) Profiles along the jet axis Full thick line - Br; Dashed thick - continuum Full thin - H2; Dashed thin - [FeII] Br coincident with source continuum position, except in closest source, HH 300-IRS; offset by 0.026”(0.005”) = 3.6(0.7)AU
H2 [FeII] 100 AU 100 AU 100 AU Expansion of each flow component H2 - red; [FeII] - blue …..Collimated (unresolved) over first 100-200 AU [FeII] H2 100 AU 100 AU 100 AU H2 and [FeII] opening angles of order 20-40 degs over first 100-200 AU
H-band spectra 1.46-1.86 m Forbidden [FeII] Hydrogen recombination Only see (veiled) absorption lines from most evolved source, HH 83-IRS 0.5” aperture centre on the source
K-band spectra 1.95-2.42 m H2 and [FeII] Nebula emission lines Strong CO bandheads Again, only see (veiled) absorption lines from most evolved source, HH 83-IRS 0.5” aperture centre on the source
HH 34-IRS versus HH 83-IRS (young vs old…) R ~ 1500 just about makes the cut. Higher spectral resolution would certainly result in better data!
r = 0.98 P = 2% Correlation between emission lines - 1 r = 0.95 P = 6% Apparent correlation between nebula lines and high-density inner-disk tracer, CO r = 0.87 P = 8%
r = 0.83 P = 21% However, little or no correlation between outflow tracers (H2 and [FeII]) and CO Is this a result of the H2/[FeII] excitation mechanism, and the short cooling times in the post-shock gas (few years)? Correlation between emission lines - 2 r = 0.34 P = 59%
De-reddening J-H and H-K colours in a C-C diagram Av= 10 Extinction towards the Jet Base - 1 J-H TTS locus H-K
HH 26-IRS (Av = 27) H2 rotational diagrams minimising scatter about linear or second-order polynomial fits Extinction towards the Jet Base - 2 • R2 - square of correlation coefficient • Vary Av - measure R2 • (goodness of fit). • Best R2 gives Av • o/p =2.53; Tex= 2976 K
HI line ratios - case B recombination, but ratios only consistent with high densities (109-1010 cm-3) and low T (2,000K) - see also Bary et al. 2010 • H2and [FeII] line ratios - but best if J and H-band [FeII] lines Extinction towards the Jet Base - 3 • Range in extinction values • No method is entirely satisfactory…. • Measuring Av is a major issue when trying to probe and quantify the • physical conditions at the jet base (particularly for the more embedded • Class I sources)
Extinction maps from H2and [FeII] line ratios Signs of decreasing extinction along each jet axis… (IGRINS - along the slit!)
Electron Density (and Temperature) from [FeII] line ratios J-band needed to constrain Te but H band to constrain density, ne (relatively insensitive to Te) ne ~ 104 - 105 cm-3 Models + HH1 data; Nisini et al. (2005)
Some Conclusions… Abundance of (bright) diagnostic lines produced at the base of (and along the length of) these HH jets IFU spectroscopy - excellent tool for studying these regions … but … Long-slit spectroscopy with IGRINS would be extremely useful: velocity and excitation info along the flow (just don’t forget to align the slit with the jet axis!!)
Some Conclusions…(from our IFU data) No obvious indication that [FeII] jet component is more collimated than the H2 component However, high velocities accompanied by smaller opening angles Extinction decreases rapidly along jet axis Electron density decreases rapidly along jet axis Need better spatial AND spectral resolution to properly test/constrain jet collimation and acceleration models.
Unbiased survey of the Inner Galactic Plane in the H2 1-0S(1) line at 2.122μm • Data obtained with WFCAM: sub-arcsec resolution; 800 sec/pixel; >18th mag • Complements UKIDSS Galactic-Plane JHK imaging • Covers 150 square degrees (10° < l < 65°, |b| ~ 1°) - GLIMPSE-N Data acquired forl ~ 10 - 26°, |b| ~ 1.5° and l ~ 26 - 37°, |b| ~ 0.5° http://astro.kent.ac.uk/uwish2/
1052 MHOs separated into 22 Tables (based on constellations) • Updated weekly online; first 1000 objects in CDS; handy Search tool !!! http://www.jach.hawaii.edu/UKIRT/MHCat/
Simple ascii tables also available, for overplotting on other images/data-sets http://www.jach.hawaii.edu/UKIRT/MHCat/
UWISH2 http://astro.kent.ac.uk/uwish2 (or Google “UWISH2”) MHO Catalogue http://ww.jach.hawaii.edu/UKIRT/MHCat (or Google “MHO catalogue”)