Download
1 / 32
320 likes | 494 Vues
Gulf of Alaska. Climate and Oceanography. Pacific Decadal Oscillation. positive phase negative phase. tao.atmos.washington.edu/pdo/. Winter PDO score (November – March). jisao.washington.edu/pdo/PDO.latest. Pacific Decadal Oscillation. Oceanographic correlates:

E N D
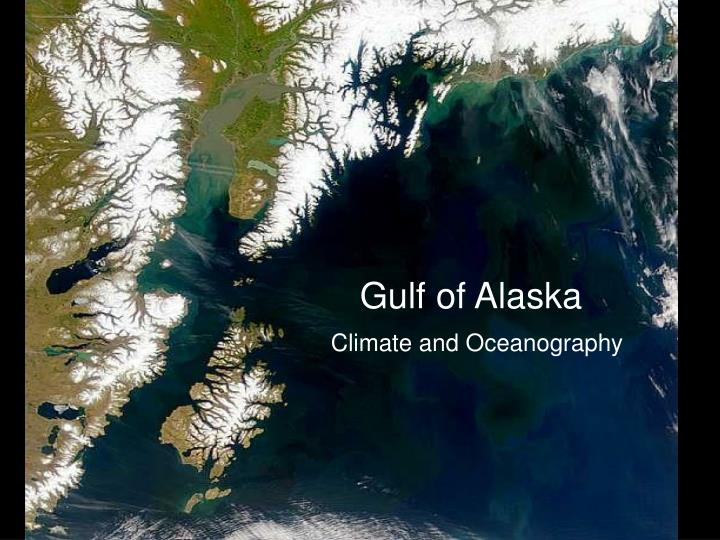
Gulf of Alaska Climate and Oceanography
Pacific Decadal Oscillation positive phase negative phase tao.atmos.washington.edu/pdo/ Winter PDO score (November – March) jisao.washington.edu/pdo/PDO.latest
Pacific Decadal Oscillation • Oceanographic correlates: • Atmospheric pressure - Air / sea temperature • Freshwater input - Surface salinity • - Mixed layer depth - Upwelling / downwelling strength • Wind stress - Sea ice extent / time of thaw • Nutrient flux - Current strength / gyre circulation • Solar radiation absorption - Aerosol (dimethylsulfide) production • Primary productivity - Secondary productivity
Pacific Decadal Oscillation Effect on trophic level of Alaska’s commercial fishery landings 1964-2003
Mantua et al. 1997, Minobe 1997 Pacific Decadal Oscillation PDO journal articles listed in Web of Science
Principal component 2 - Victoria Pattern 2.0 1.0 0.0 Victoria Pattern score -1.0 -2.0 (Bond et al. 2003. Geophys. Res. Let. 30:2183) -3.0 1950 1960 1970 1980 1990 2000 jisao.washington.edu/pdo/PDO.latest
P > 0.1 P < 0.0001 Community state (NMDS axis1) (Rodionov. 2004. Geophys. Res. Let. 31:L09204) P < 0.0001 Catch composition of small-mesh trawls in three Alaska Peninsula Bays July – October hauls; Chignik-Castle, Kuiukta, Pavlof Bays More groundfish More capelin & shrimp
Average North Pacific temperature Average global temperature Temperature anomaly relative to 1961-1990 (ºC) Temperature anomaly relative to 1961-1990 (ºC) East Anglia University, UK www.cru.uea.ac.uk/cru/data/temperature/#datdow East Anglia University, UK www.cru.uea.ac.uk/cru/data/temperature/#datdow Winter PDO score (November – March) jisao.washington.edu/pdo/PDO.latest
Overview: GOA Climate and Oceanography Posters GEM Biophysical Observations Aboard the Alaskan State Ferries, E. Cokelet et al. Early Holocene / Late Pleistocene Shoreline North of the Present Ice Margin of the Bering Sea, A. Pasch & N. Foster A Catalog of Marine Gap Winds for the Western and Northern Gulf of Alaska, J. Curtis & N. Bond Yakutat Eddies and Shelf/Slope Exchange in the Coastal Gulf of Alaska, M. Janout et al. Nutrient Dynamics in the Gulf of Alaska, C. Mordy et al. Oceanographic Boundary Conditions to Cook Inlet, W. Pegau et al. hour day month year decade century millennium Time scale of data collection
A Catalog of Marine Gap Winds for the Western and Northern Gulf of Alaska Joel Curtis and Nicholas Bond
Oceanographic Boundary Conditions to Cook Inlet W. Scott Pegau, Edward Cokelet and Susan Saupe
Yakutat Eddies and Shelf/Slope Exchange in the Coastal Gulf of Alaska Markus Janout, S. Okkonen, T. Weingartner, D. Musgrave, and T. Royer surface salinity sea surface height bathymetry
Yakutat Eddies and Shelf/Slope Exchange in the Coastal Gulf of Alaska Markus Janout, S. Okkonen, T. Weingartner, D. Musgrave, and T. Royer
Yakutat Eddies and Shelf/Slope Exchange in the Coastal Gulf of Alaska Markus Janout, S. Okkonen, T. Weingartner, D. Musgrave, and T. Royer
GEM Biophysical Observations Aboard the Alaskan State Ferry Tustumena Edward Cokelet, A. J. Jenkins, W. S. Pegau, C. W. Mordy, and M. Sullivan
GEM Biophysical Observations Aboard the Alaskan State Ferry Tustumena Edward Cokelet, A. J. Jenkins, W. S. Pegau, C. W. Mordy, and M. Sullivan
Nutrient Dynamics in the Gulf of Alaska Calvin Mordy, Peter Proctor, Sigrid Salo, Phyllis J. Stabeno, and David P. Wisegarver
Invertebrate Evidence for an Early Holocene / Late Pleistocene Shoreline North of the Present Ice Margin of the Bering Glacier Anne D. Pasch and Nora R. Foster
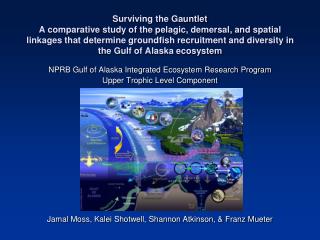
Mike Litzow1 & Lorenzo Ciannelli2 1Alaska Fisheries Science Center, NOAA Fisheries 2Center for Ecological and Evolutionary Synthesis, University of Oslo Has Climate Change Produced Oscillating Ecosystem Control in the Gulf of Alaska?
Taxa involved in PDO-driven community reorganizations Salmon Shrimp Zooplankton Gadids Flatfishes Capelin Jellyfish Seabird / pinniped diets Sardines Anchovies Zooplankton Salmon Anchovies Zooplankton Sardines Mackerel Hake Rockfish Sablefish Seabirds Sardines Anchoveta Seabirds Tuna Tuna
Estimated age 3+ biomass 76/77 regime shift 103 metric tons Average of models 2 & 3, 2006 SAFE document Proportion of occurrence in NMFS bottom trawls Warm regime 1978 - 2005 Cold regime 1954 - 1975 Proportion of hauls with cod Proportion of hauls with cod PDO regime shift and Gulf of Alaska cod abundance
Pavlof Bay small-mesh trawl data CPUE (kg / km towed) July – October, n = 593 hauls
Cod-shrimp interactions Cod exercise top-down control on shrimp populations in N. Atlantic (Worm and Myers 2003. Ecology 84:162-173) Cod regulation cascades to zooplankton, phytoplankton and nutrients (Frank et al. 2005. Science 308:1621-1623)
Climate effects on cod-shrimp interactions N. Pacific biological time series show non-linear dynamics / alternate stable states (Hsieh et al. 2005. Nature 435:336-340) Alternate stable states predict different ecological controls under different climate regimes – i.e., oscillating control (Scheffer et al. 2001. Nature 413:591-596)
Oscillating control hypothesis: 1970s climate regime shift resulted in change between bottom-up and top-down control in Gulf of Alaska cod-shrimp system Approach: 2) Non-additive modeling approach to test for different control under different climate regimes (Cianelli et al. 2004. Ecology 85:3418-3427, Cianelli et al. 2005. Proc. R. Soc B 272:1735-1743) Approach: 1) Cod-shrimp abundance correlations negative correlation = top down control positive or weak correlation = bottom-up control (Worm and Myers 2003. Ecology 84:162-173) multi-modal distribution of controlling parameters necessary condition of alternate states (Scheffer et al. 2001. Nature 413:591-596)
1) Correlation approach 1 Bottom-up control 94 82 89 95 74 86 87 85 96 88 97 02 84 81 83 00 03 98 75 01 Correlation strength (running 5-yr Pearson’s r) 0 99 80 90 92 91 93 Top-down control 79 76 77 78 -1 0 1 -2 -1 Count Temperature index (PC1 score) Climate regulation of top-down and bottom-up ecosystem control Temperature effects on running 5-yr correlation between cod and standardized prey abundance (capelin and 4 shrimp species) Model R2 = 0.42, P(temperature) = 0.005
Non-additive modeling approach Selects between competing models: Generalized Additive Model (GAM): response variable estimated by adding effects of smoothing functions for each explanatory variable Nonadditive model: constructs separate GAMs for data below and above threshold value in some environmental or biological parameter Choice of additive or non-additive model, and selection of threshold value, made by minimizing # of parameters and maximizing model fit to data
2) Non-additive modeling approach Effect on cod abundance P < 0.001 P = 0.03 P = 0.01 Log (cod CPUE) lag 1 yr Temperature index (PC1 score) Prey abundance index Additive model of cod abundance Model R2 = 0.74
2) Non-additive modeling approach More groundfish Threshold Community state (NMDS axis 1) More shrimp & capelin Below threshold Above threshold P = 0.003 P = 0.08 Effect on pink shrimp abundance Effect on pink shrimp abundance Log (cod CPUE) Temperature (PC1 score) Non-additive factors affecting pink shrimp abundance Model R2 = 0.85
Conclusions 1) Support for hypothesis that climate change has produced oscillating control in Gulf of Alaska – shifts between bottom-up and top-down control - temperature regulation of top-down and bottom-up control of cod-shrimp interactions - non-additive control of shrimp populations, depending on community state 2) Results demonstrate limitations in using annual-scale variability to study decadal-scale patterns in climate-ecosystem interactions
Acknowledgements Paul Anderson, Dave Jackson, Alisa Abookire, Franz Mueter and everyone who helped collect small-mesh trawl data through the years…


![Freshwater Variability on the Gulf of Alaska Shelf [ OS42A-01 ]](https://cdn2.slideserve.com/3972677/slide1-dt.jpg)