Download
1 / 1
390 likes | 1.82k Vues
Graphing Limiting Reactants. Consider the reaction of iron(III) chloride with sodium hydroxide. FeCl 3 ( aq ) + 3 NaOH ( aq ) → Fe(OH) 3 (s) + 3 NaCl ( aq )

E N D
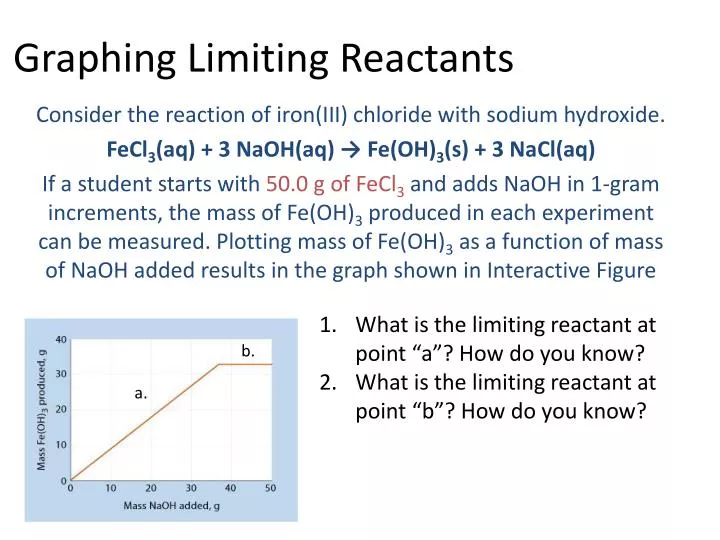
Graphing Limiting Reactants Consider the reaction of iron(III) chloride with sodium hydroxide. FeCl3(aq) + 3 NaOH(aq) → Fe(OH)3(s) + 3 NaCl(aq) If a student starts with 50.0 g of FeCl3and adds NaOH in 1-gram increments, the mass of Fe(OH)3 produced in each experiment can be measured. Plotting mass of Fe(OH)3 as a function of mass of NaOH added results in the graph shown in Interactive Figure What is the limiting reactant at point “a”? How do you know? What is the limiting reactant at point “b”? How do you know? b. a.