Download
1 / 35
370 likes | 573 Vues
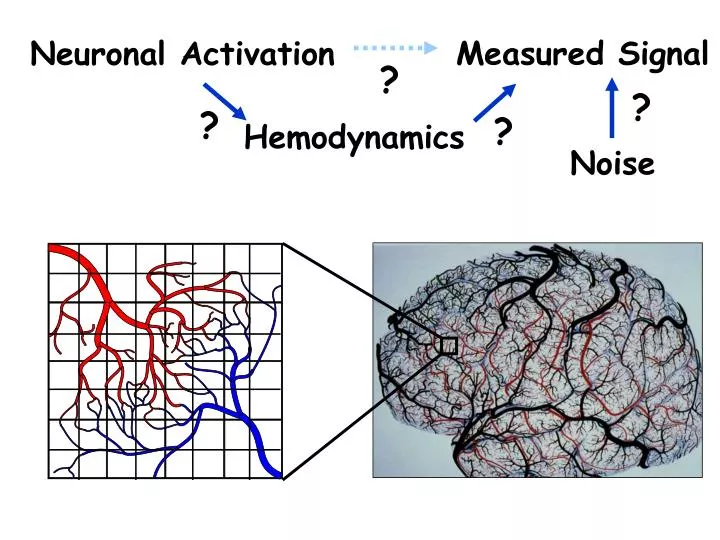
Measured Signal. Neuronal Activation. ?. ?. ?. ?. Hemodynamics. Noise. Dynamics Fluctuations Pattern Information Neuronal Current MRI. The BOLD Signal. B lood O xygenation L evel D ependent (BOLD) signal changes. task. task.

E N D
Measured Signal Neuronal Activation ? ? ? ? Hemodynamics Noise
Dynamics • Fluctuations • Pattern Information • Neuronal Current MRI
The BOLD Signal Blood Oxygenation Level Dependent (BOLD) signal changes task task
Brief “off” periods produce smaller decreases than expected. measured 2 1.5 0 linear Signal (%) 1 Linearity -2 measured 0.5 linear -4 0 0 5 10 15 20 time (s) Stimulus OFF duration (s) R.M. Birn, P. A. Bandettini, NeuroImage, 27, 70-82 (2005) Brief “on” periods produce larger increases than expected. measured linear 3 Linearity 2 Signal linear 1 0 1 2 3 4 5 time (s) Stimulus Duration (s) R. M. Birn, Z. Saad, P. A. Bandettini, NeuroImage, 14: 817-826, (2001)
MEG & fMRI Linearity Comparison A. Tuan, R. M. Birn, P. A. Bandettini, G. M. Boynton, (submitted)
MEG Results • Tuan, R. M. Birn, P. A. Bandettini, G. M. Boynton, • International Journal of Imaging Systems and Technology 18, 17-28 (2008)
Measured and Predicted BOLD responses Non-linearity computed from MEG prediction 3 0s ramp 0.5s ramp 1s ramp Non-linearity 2 1 0 5 10 15 Stimulus Duration Non-linearity computed from BOLD 3 Non-linearity 2 1 0 5 10 15 Stimulus Duration (s) BOLDMEG • Tuan, R. M. Birn, P. A. Bandettini, G. M. Boynton, • International Journal of Imaging Systems and Technology 18, 17-28 (2008)
Dynamics • Fluctuations • Pattern Information • Neuronal Current MRI
Resting State Correlations Activation: correlation with reference function Rest: seed voxel in motor cortex B. Biswal et al., MRM, 34:537 (1995)
Sources of time series fluctuations: • Blood, brain and CSF pulsation • Vasomotion • Breathing cycle (B0 shifts with lung expansion) • Bulk motion • Scanner instabilities • Changes in blood CO2 (changes in breathing) • Spontaneous neuronal activity
5 Z 0 5 % Breath-holding Group Maps (N = 7) MR Signal Respiration Cue time (s) 0 50 100 150 200 250 300 350 Breath-hold response (average Z-score) Anatomy R.M. Birn, J. A. Diamond, M. A. Smith, P. A. Bandettini, NeuroImage, 31, 1536-1548
50 100 150 200 250 300 350 1 0.5 CC 2 0 CO2 0 50 100 150 200 250 300 350 -0.5 RVT -20 -10 0 10 time (s) 0 Shift (s) 0 50 100 150 200 250 T max min 300 310 315 305 time (s) max - min RVT = T Estimating respiration volume changes Respiration time (s) Respiration Volume / Time (RVT) RVT precedes end tidal CO2 by 5 sec.
0 BOLD Z Respiration Cue 0 100 200 300 Time (sec) -4 5 Z BOLD Respiration RVT 0 0 100 200 300 Time (sec) Respiration induced signal changes Rest Breath-holding (N=7) R.M. Birn, J. A. Diamond, M. A. Smith, P. A. Bandettini, NeuroImage, 31, 1536-1548 (2006)
Resting state correlation with signal from posterior cingulate Resting state correlation with RVT signal 10 6 |Z| Z 0 -10 RVT Correlation Maps &Functional Connectivity Maps Group (n=10) R.M. Birn, J. A. Diamond, M. A. Smith, P. A. Bandettini, NeuroImage, 31, 1536-1548 (2006)
Effect of Respiration Rate Consistency on Resting Correlation Maps Spontaneously Varying Respiration Rate Constant Respiration Rate 10 10 Z Z -10 -10 Group (n=10) R.M. Birn, J. A. Diamond, M. A. Smith, P. A. Bandettini, NeuroImage, 31, 1536-1548 (2006)
Temporal Signal to Noise Ratio (TSNR) vs. Signal to Noise Ratio (SNR) J. Bodurka, F. Ye, N Petridou, K. Murphy, P. A. Bandettini, NeuroImage, 34, 542-549 (2007)
Sensitivity, Scan Time, and Temporal Signal to Noise K. Murphy, J. Bodurka, P. A. Bandettini, NeuroImage, 34, 565-574 (2007)
Multi-sensory integration M.S. Beauchamp et al., Visual Auditory Multisensory
Dynamics • Fluctuations • Pattern Information • Neuronal Current MRI
Pattern Information Mapping “searchlight” ROI N. Kriegeskorte, R. Goebel, P. Bandettini, Proc. Nat'l. Acad. Sci. USA, 103, 3863-3868 (2006) From fixed ROI
96 0 0 0 0 0 0 dissimilarity matrix 96 0 0 0 0 0 0 96 Dissimilarity Matrix Creation compute dissimilarity (1-correlation across space) response patterns ... ROI in Brain stimuli ... N. Kriegeskorte, et al, Neuron (in press)
Human Early Visual Cortex(1057 visually most responsive voxels) Human IT(1000 visually most responsive voxels)
Human fMRI in four subjects(repeated sessions,>12 runs per subject) "quick" event-related design(stimulus duration: 300ms,stimulus onset asynchrony: 4s) fixation task(with discrimination of fixation-point color changes) occipitotemporal measurement slab(5-cm thick) small voxels (1.951.952mm3) 3T magnet, 16-channel coil (SENSE, acc. fac. 2) Monkey (Kiani et al. 2007) single-cell recordingsin two monkeys rapid serial presentation(stimulus duration: 105ms) fixation task electrodes in anterior IT(left in monkey 1, right in monkey 2) 674 cells total windowed spike count(140-ms window starting 71ms after stimulus onset) Monkey-Human Comparison Procedure
average of 4 subjects fixation-color task 316 voxels average of 2 monkeys fixation task >600 cells N. Kriegeskorte, et al Neuron (in press)
Dynamics • Fluctuations • Pattern Information • Neuronal Current MRI
Magnetic Field Intracellular Current Surface Fields 100 fT at on the scalp J.P. Wikswo Jr et al. J Clin Neuronphy 8(2): 170-188, 1991
Surface Field Distribution Across Spatial Scales Adapted from: J.P. Wikswo Jr et al. J Clin Neurophy 8(2): 170-188, 1991
Magnetic field associated with a bundle of dendrites Because BMEG=100fTis measured by MEG on the scalp at least50,000 neurons(0.002 fT (per dendrite) x 50,000 = 100 fT), must coherently act to generate such field. These bundles of neurons produce, within a typical voxel, 1 mm x 1 mm x 1 mm, a field of order: BMRI0.2nT
B0 calculated Bc ||B0 Measurement 70 A current 200 Single shot GE EPI Correlation image J. Bodurka, P. A. Bandettini. Magn. Reson. Med. 47: 1052-1058, (2002).
Cortex Basal Ganglia 100 mm Plenz, D. et al. Neurosci 70(4): 861-924, 1996 in vitro model Organotypic (no blood supply or hemoglobin traces) sections of newborn-rat somato-sensory Cortex &Basal Ganglia • Size: in-plane:~1-2mm2, thickness: 60-100m • Neuronal Population: 10,000-100,000 • Spontaneous synchronized activity < 2Hz • Epileptiform activity • Spontaneous beta freq. activity (20-30Hz) • Network Activity Range: ~ 0.5-15V
1: culture 2: ACSF ACSF Culture C C A A B B FSE image Hz Hz 0.15Hz map 1 2 3 Tesla data Active condition: black line Inactive condition: red line A: 0.15 Hz activity, on/off frequency B: activity C: scanner noise (cooling-pump)
7 Tesla data TTX Power decrease between PRE & TTX EEG : ~ 81% Decrease between PRE & TTX MR phase: ~ 70% Decrease between PRE & TTX MR magnitude: ~ 8% N. Petridou, D. Plenz, A. C. Silva, J. Bodurka, M. Loew, P. A. Bandettini, Proc. Nat'l. Acad. Sci. USA. 103, 16015-16020 (2006).